Guides · Oct 21, 2026
A Crypto Index Chart Reading 1,000 Tells You Nothing. Here Is What to Read Instead.
GuidesIndices
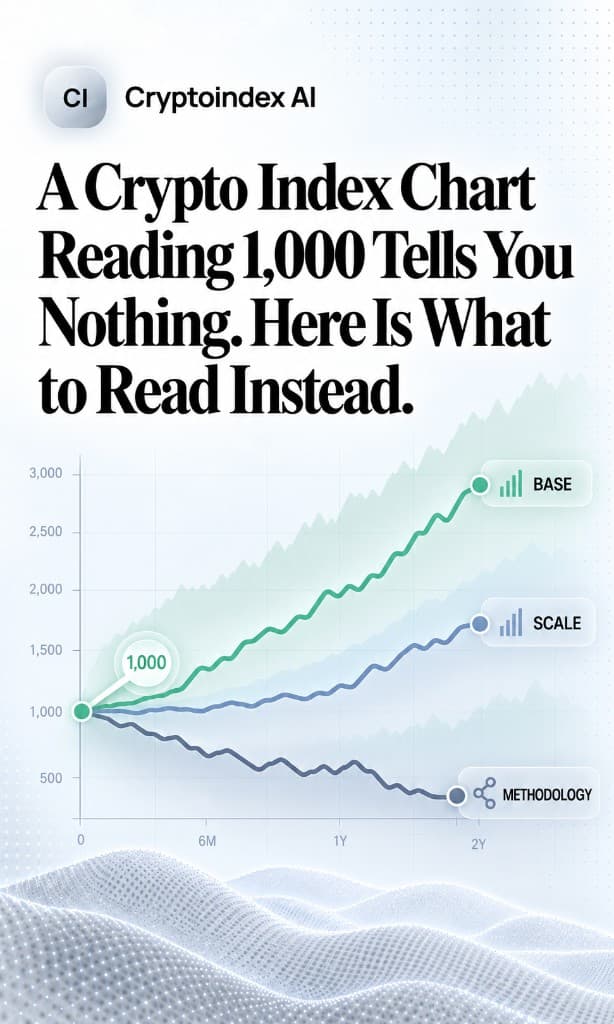
A level of 1,000 is a starting point, not a price. Read the base date, the live date and the divisor before comparing two crypto index charts.
Open a crypto index chart and the first number you see is the level. It might say 1,000. It might say 4,312. Whatever it says, that number on its own carries almost no information, and treating it as a price is the single most common mistake people make with index data.
An index level is a ratio to an arbitrary starting point. The SIX Crypto Market Index 10 was set to 1,000 on 30 December 2016. The SDX Bitcoin Capped index was set to 1,000 on 2 August 2019. Those two indices could print the same level on the same day while describing completely different performance, because they are measuring from different starting lines.
What a chart actually encodes is a chain of decisions: when the series starts, when it started being calculated live rather than reconstructed afterwards, what happens to the line when a constituent is swapped, whether staking rewards are in or out, and whether the value you are looking at is the official one.
Get those five things wrong and you will misread the chart. Get them right and an index chart becomes the most useful picture in this market, because it is the only one that shows you what the market did rather than what one asset did.
TL;DR
- The level is a ratio, not a price. Compare percentage change over a period, never two index levels against each other.
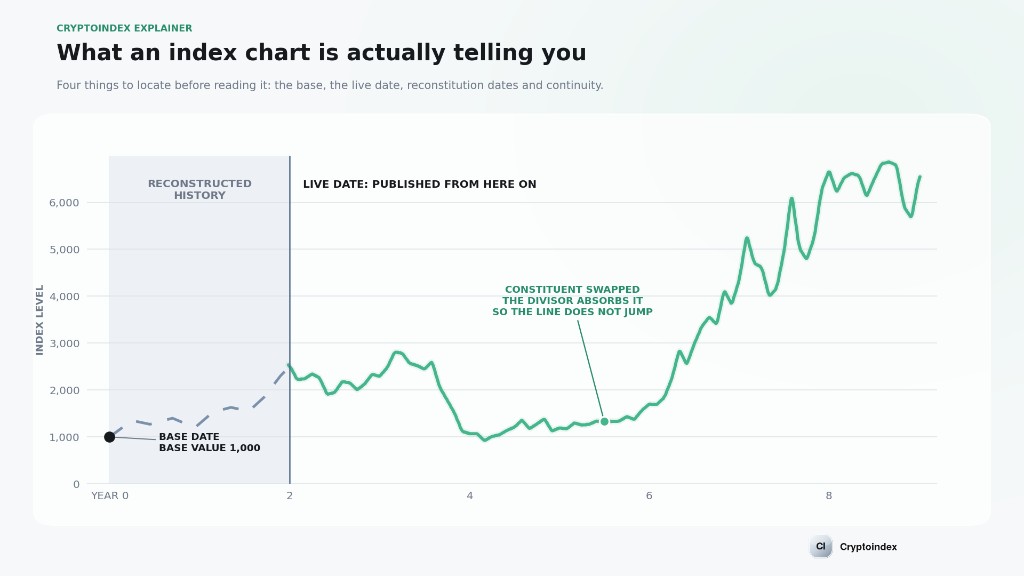
- Check the base date and the live date separately. SIX's CMI10 has a base date of 30 December 2016 but only went live on 9 January 2018, so roughly the first year of that chart is reconstructed history, not a record of published values.
- A reconstitution should never make the line jump. The divisor absorbs the change. If a chart gaps on a rebalance day, the series is wrong.
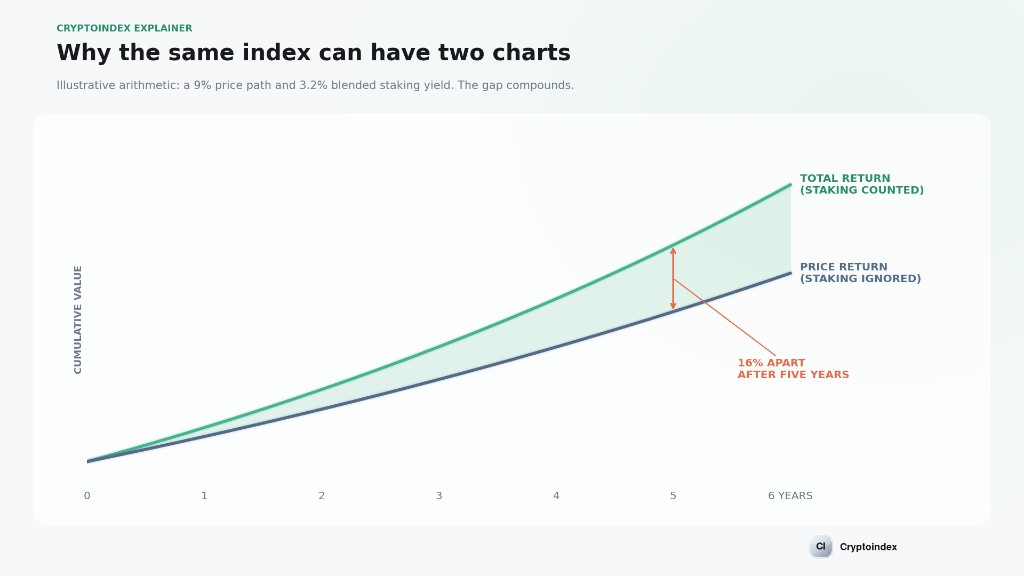
- Price return and total return now differ materially, because staking yield is real money and indices differ on whether they count it.
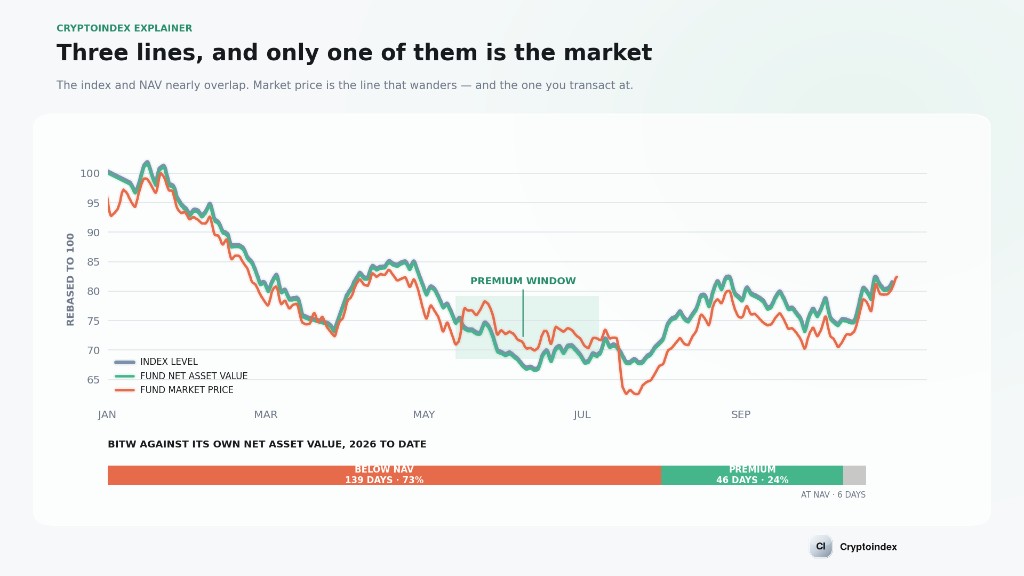
- The index chart and the fund chart are not the same picture. BITW traded below its own net asset value on 139 of 191 trading days in 2026 to date, so the index line, the NAV line and the market price line tell three different stories.
- Most funds track a settlement value, not the live tick. NCIQ tracks the daily closing value of the Nasdaq CME Crypto Index, not the intraday calculation you watch during the day.
1. The level is a ratio
Every index starts with someone choosing a date and a number. The number is usually 100 or 1,000 because round numbers make percentage arithmetic easy, and it is otherwise meaningless.
From that moment the index is computed as:
level = base value × (current basket value ÷ basket value at base date)
So a level of 2,400 on an index based at 1,000 means the basket has grown 140% since the base date. A level of 2,400 on an index based at 100 means it has grown 2,300%. The number alone is not interpretable, which is why professional index documentation always puts the base value and base date in the first paragraph.
The practical rule: compare changes, not levels. If you want to know whether a broad crypto index outperformed bitcoin over the last quarter, take the percentage change of each over that quarter. Never put two index levels side by side and conclude anything.
2. The base date and the live date are different dates
This is where most published crypto index charts quietly mislead, and it is easy to check.
An index has a base date, which is where the series starts, and a live date, which is when the provider actually began calculating and publishing it. If those differ, everything between them is backfilled: computed afterwards, using the methodology as it exists now, applied to historical prices.
SIX's Crypto Market Index 10 has a base date of 30 December 2016 and went live on 9 January 2018. So about twelve months of that chart was reconstructed. The SDX index family was announced in September 2021 with base dates in 2019, so the same applies.
Backfilled history is not dishonest. It is standard practice across all asset classes, and providers disclose it. But it has two properties worth holding onto when you look at a long chart.
It is free of implementation friction. The reconstructed period has no bid-ask spreads, no failed fills, no exchange outages, and no asset that was technically in the index but impossible to buy in size that week.
It is built with hindsight about the methodology. The rules were chosen by people who already knew which assets survived 2018. That is not fraud, it is just a different kind of information than a live record.
So when you are looking at a five-year index chart, find the live date and treat the two halves differently. The honest way to read it: before the live date, this is what the rules would have produced. After the live date, this is what they did produce.
3. The divisor is why the line does not jump
Here is the mechanic that makes index charts work, and the one thing you can use to sanity-check any index series in about ten seconds.
When an index swaps a constituent out and another in, the value of the underlying basket changes instantly. Asset A leaves, asset B arrives, and they are not the same size. If the index simply reported basket value, the chart would gap on every reconstitution date, and the series would be useless for measuring performance.
So indices carry a divisor: a number that is recalculated at every composition change so that the index level immediately before and immediately after the change is identical. All of the performance effect of the swap shows up afterwards, in how the new basket behaves. None of it shows up as an artificial jump.
This gives you a free quality test. Pull up any index chart and look at its known reconstitution dates. For a quarterly index, that is four dates a year. If the line gaps on those dates, the series has been stitched together rather than properly indexed, and you should not use it for anything that matters.
The same mechanic explains something that confuses people about weights. A capped index that says it caps its largest constituent at 30% enforces that cap at rebalance, not continuously. Between rebalance dates, prices move the weights wherever they want. So a chart of a "30% capped" index can perfectly legitimately represent a basket running at 35% bitcoin for six weeks. We went through the full set of rebalance mechanics in our guide to rebalancing.
4. Price return, total return, and staking
In equities this distinction is old and well understood: a price index ignores dividends, a total return index reinvests them. In crypto it was irrelevant for years, because the assets paid nothing.
That is no longer true. A material share of the assets in any broad crypto index now produce staking yield, and several of the listed products hold staked positions. Which means the gap between a price-return series and a total-return series is real, it compounds, and it is not small.
Two charts of the same index can therefore diverge steadily for a completely legitimate reason. If you are comparing a crypto index chart against a fund, you need to know three things:
- Is the index price return or total return?
- Does the fund stake its assets?
- If it does, does the yield accrue to shareholders or get consumed by expenses?
A total-return index compared against a fund that does not stake will show the fund underperforming its benchmark by roughly the yield, every year, forever. That is not tracking error in any interesting sense. It is a benchmark mismatch, and it is on whoever picked the benchmark.
5. The index chart, the NAV chart and the price chart
Three lines, routinely confused, especially when people search for a live chart of a listed index fund.
The index level is what the rules produce from market prices. It has no fees, no cash drag and no trading.
The fund's net asset value is what the fund's holdings are actually worth per share, after its fee. It should track the index closely, falling behind by roughly the fee over time, plus whatever the fund loses to rebalancing friction.
The fund's market price is what somebody paid for a share on the exchange. It can sit above NAV (a premium) or below it (a discount), depending on demand for the wrapper rather than the assets.
For crypto index funds this third line is not a technicality. BITW's own published data shows that in 2026 to date it traded below net asset value on 139 of 191 trading days, at a premium on 46, and at NAV on 6. A chart of the fund's market price over that period is therefore a chart of the index plus a mostly negative, mostly variable adjustment.
So if you bought and sold on market, your return was not the index return minus the fee. It was the index return, minus the fee, plus or minus the change in the discount between your two trades. That last term is invisible on the index chart and it is often larger than the fee.
The practical consequence: when you want to know what the market did, read the index chart. When you want to know what you would have earned, read the fund's market price chart and check the premium and discount history. They answer different questions. We covered the cost side of this in detail in our analysis of index fund fees.
6. Live values, settlement values, and tickers
The last piece is the one almost nobody checks: the number you are watching is probably not the official number.
Most serious index families publish one official value per day, calculated at a fixed time from a defined pricing source. That settlement value is what funds mark against, what derivatives settle to, and what goes into the historical series. The real-time number streaming on a chart during the day is a live calculation, useful for watching the market, but it is not the value of record.
You can see this stated explicitly in product documentation. The Hashdex fund NCIQ tracks the Nasdaq CME Crypto Settlement Price Index, described as the daily closing value of the Nasdaq CME Crypto Index, calculated by CF Benchmarks. The live index and the settlement index are two different series with two different identifiers.
That is also the answer to the ticker question. Crypto index tickers come in three kinds and they are not interchangeable:
- Index tickers, maintained by the index provider. These identify the calculation. They are not tradeable and they often have separate codes for the real-time and settlement versions.
- Fund tickers, like BITW or NCIQ, which identify a listed security tracking that index.
- Dominance and ratio series, like bitcoin dominance, which are derived measures rather than baskets. They have no base value and no divisor, because they are a percentage by construction. Our dominance page tracks these separately for exactly that reason.
Searching a fund ticker gets you a price chart for the wrapper. Searching the index ticker, where the provider publishes it, gets you the benchmark. If you want the market, you want the second one.
The ten-second checklist
Before you draw a conclusion from any crypto index chart:
- Base date and base value. Stated anywhere? If not, the level means nothing.
- Live date. How much of this chart is reconstructed?
- Reconstitution dates. Does the line gap on them? It should not.
- Price return or total return. And does the thing you are comparing it to stake?
- Index, NAV or market price. Which of the three lines is this?
- Live or settlement. Is this the value of record, or an intraday calculation?
- Does the universe include stablecoins? A total market cap chart that includes roughly $309bn of stablecoins is partly a chart of dollar supply, not of crypto prices. We unpacked that in our stablecoin dominance analysis.
Six of those seven take one look at a methodology document. The seventh is the one that changes the most conclusions.
Live levels, constituents and weights for the indices we calculate are on the Cryptoindex indices page, with the base dates and divisor treatment documented on our methodology page. If you want to see what a chart of your own basket would look like under a different weighting or rebalance rule, you can build one and replay it in Cryptoindex Pro. As always with a reconstructed series: no trading costs, every fill at the printed price, and assembled by someone who already knows how the story ended.
FAQ
What does a crypto index chart actually show? The value of a defined basket of crypto assets over time, expressed relative to an arbitrary base value on an arbitrary base date. It shows the market's direction and magnitude, not a price you can transact at.
Why do two crypto index charts of the same market look different? Four common reasons: different base dates, different constituent universes, one being price return and the other total return, and one including stablecoins while the other excludes them. All four are legitimate design choices and all four are disclosed in the methodology.
What does a crypto index level of 1,000 mean? Usually that you are looking at the index on or near its base date, or at an index whose base value was set to 1,000. On its own it means nothing about valuation. Only the change in the level over a period is interpretable.
Where can I find a live crypto index? Index providers publish real-time levels, but the value of record is normally a single daily settlement value. For a live view of broad market indices, dominance and sentiment together, see our indices page.
What is a crypto index ticker? A code identifying either the index calculation itself (maintained by the index provider, often with separate codes for real-time and settlement) or a listed fund tracking that index, such as BITW or NCIQ. The two are different things and the charts behave differently.
Why does the fund chart not match the index chart? Three reasons, in order of size: the fund's fee, the premium or discount to net asset value, and tracking friction from rebalancing. The discount is often the largest of the three in crypto index funds.