Index Methodology
The Crypto Fear and Greed Index Is Missing a Sixth of Itself
 Roman Wiligut· Analyst and AI Researcher
Index Methodology · Sep 6, 2026
Index MethodologyFear & Greed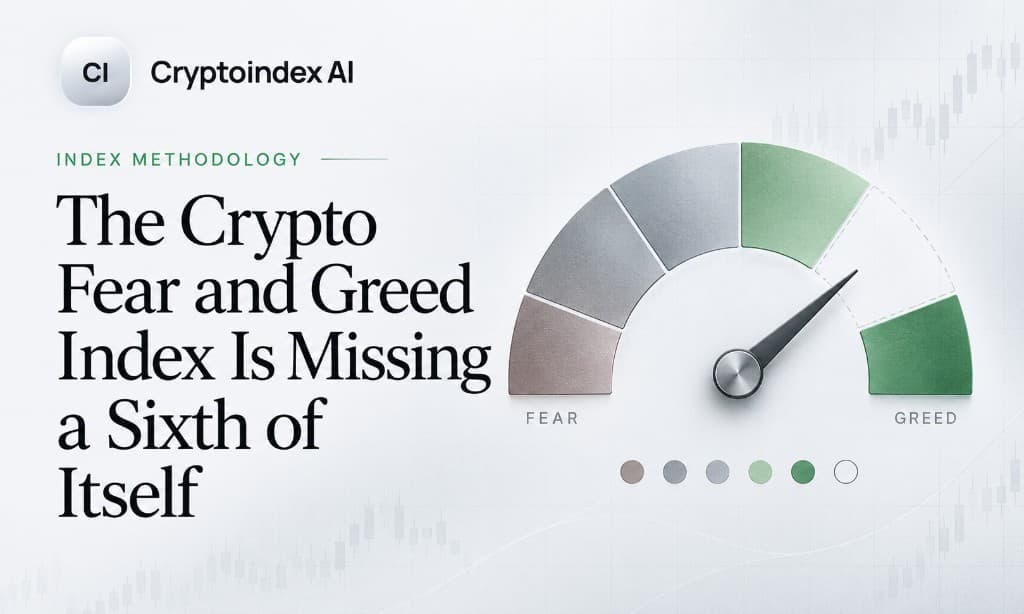
Five of six Fear and Greed inputs are running. The survey is not, and almost nobody mentions it. Why the gap is smaller than it sounds - and why the docs still matter.
The published methodology for the Crypto Fear and Greed Index lists six components. Volatility at 25%, market momentum and volume at 25%, social media at 15%, surveys at 15%, bitcoin dominance at 10%, Google Trends at 10%.
Five of those six are running. The surveys are not, and have not been for years.
The survey component used to be a weekly poll run through Strawpoll, pulling in roughly 3,000 responses a week. It was the only part of the index that asked human beings what they thought. It is currently paused, with the provider noting it may return at some point. Meanwhile the score you see every day is calculated from the remaining five inputs, rescaled to fill the gap.
Almost every article about this index reproduces the six-component table without mentioning that one of them is switched off. Here is why it matters and why it probably matters less than it sounds.
What Actually Got Removed
Look at what the five surviving components have in common.
Volatility is market data. Momentum and volume are market data. Bitcoin dominance is market data. Social media engagement is behavioural data scraped from X. Google Trends is behavioural data scraped from search.
None of them asks anyone anything. They all observe what people did.
The survey was the only stated-preference input in the whole thing. It measured what people said they expected, which is a different quantity from what they were doing with their money. Behavioural finance spends a lot of time on the gap between those two, and the index used to have one foot in each camp. Now it has both feet in the same one.
So Is the Index Broken
No, and this is worth saying clearly, because the honest answer is less dramatic than the setup.
Weekly polls of about 3,000 self-selected crypto users on a poll site are not a high-quality sample of anything. Whoever votes in that poll is, by definition, someone who visits crypto sentiment sites and enjoys clicking on polls. That population is more online, more engaged, and probably more bullish than the market as a whole.
There is also a strong argument that the survey was measuring the same thing as the social media component, just less reliably. Both capture the mood of engaged crypto participants on the internet. If two of your six components correlate heavily, dropping one loses less information than the weight suggests.
So the practical damage is small. The index is still doing the job it does, which is compressing several observable market behaviours into one comparable number.
The problem is not accuracy. The problem is that the documentation and the product have drifted apart, and nobody flagged it.
Why This Pattern Keeps Showing Up
Once you notice it here, you start seeing it everywhere in crypto indexing.
A methodology document is written at launch. It describes an ideal construction. Then reality intervenes: a data source becomes unavailable, a partner stops providing feeds, a regulatory constraint appears, a component turns out to be more trouble than it is worth. The index keeps publishing, because it has users and a chart with history. The document does not always keep up.
We wrote recently about the Bitwise 10 index rule that requires at least 87.5% of the index weight to sit in assets with SEC-approved single-asset ETPs. That rule appeared in August 2025, well after most articles describing the index had been written. Anyone reading a 2024 explainer would have no idea it exists.
The general lesson: the methodology page tells you the design, and the design is not always what is running today.
How to Check Any Index Before Trusting It
Four questions, none of which take long.
When was the methodology last updated? Most providers publish a revision date or a changelog. If the document has not moved in three years while the market has changed completely, treat it as a historical artifact rather than a description.
Does the published weighting add to 100 in practice? If a component is paused, ask what happened to its weight. Rescaling across the survivors is the standard answer and a reasonable one, but you want to know that is what is happening rather than assume it.
How many independent inputs are there really? Not how many are listed. Components that measure the same underlying thing through different pipes are one input wearing several hats. An index with six correlated components is less diversified in its information than an index with three uncorrelated ones.
Who is the provider and what do they get out of it? Some sentiment indexes are run by exchanges with an interest in engagement, some by index administrators with reputational skin in the game, some by hobbyists. All three can be useful. They are not the same kind of thing.
What This Does Not Change
Nothing about how you should read the daily number.
The index remains a compression tool for sentiment extremes. It is bitcoin-centric, because most of its inputs derive from bitcoin. It has no derivatives data in it, so funding rates and open interest, which are among the cleanest positioning signals available, are absent. It is descriptive rather than predictive, and its extreme readings have repeatedly persisted for weeks while price kept moving in the same direction.
For reference on the extremes: the index has recorded an all-time high of 95 in June 2019 and an all-time low of 6 in June 2022. On 9 November 2021, one day before bitcoin's peak of just over $69,000, it read 84.
That last data point gets used as evidence the index calls tops. Read it more carefully. It read 84, not 95, and it had been in greed territory for a long stretch before that without a top arriving. A signal that fires many times and is right once is not a signal.
The live gauge and full history are on our Fear and Greed page. The original explainer of the score is Crypto Fear and Greed Index.
The Actual Takeaway
Use the index. It is free, it has eight years of consistent history, and one number summarising crowd behaviour is worth having on the screen.
Just hold it the way you would hold any instrument whose calibration you cannot fully verify. Watch the shape of the series rather than the daily print. Pair it with something that measures a different thing, like bitcoin dominance or the altseason breadth count. And when you read the methodology, check whether the methodology is what is actually running.
In this case, five sixths of it is.
Frequently asked questions
Is the survey component of the Fear and Greed Index still running? No. The original weekly Strawpoll survey has been paused for years. The published table still lists it at 15%, but the daily score is built from the other five inputs and rescaled.
Does that make the index inaccurate? The practical damage is small. The survey was a self-selected poll of a few thousand crypto-site visitors and overlapped with the social-media input. The larger issue is that the methodology document no longer matches what is running.
How many Fear and Greed components are live today? Five: volatility, market momentum and volume, social media, bitcoin dominance, and Google Trends.
Where is the live gauge? On the Fear and Greed page, with history and the methodology explainer.
Cryptoindex.ai publishes index data and analysis for informational purposes. Component weights and status are as described by the index provider at time of writing. Nothing here is investment advice.