Sentiment · Aug 31, 2026
Crypto Fear and Greed Index
 Roman Wiligut· Analyst and AI ResearcherSentimentFear & Greed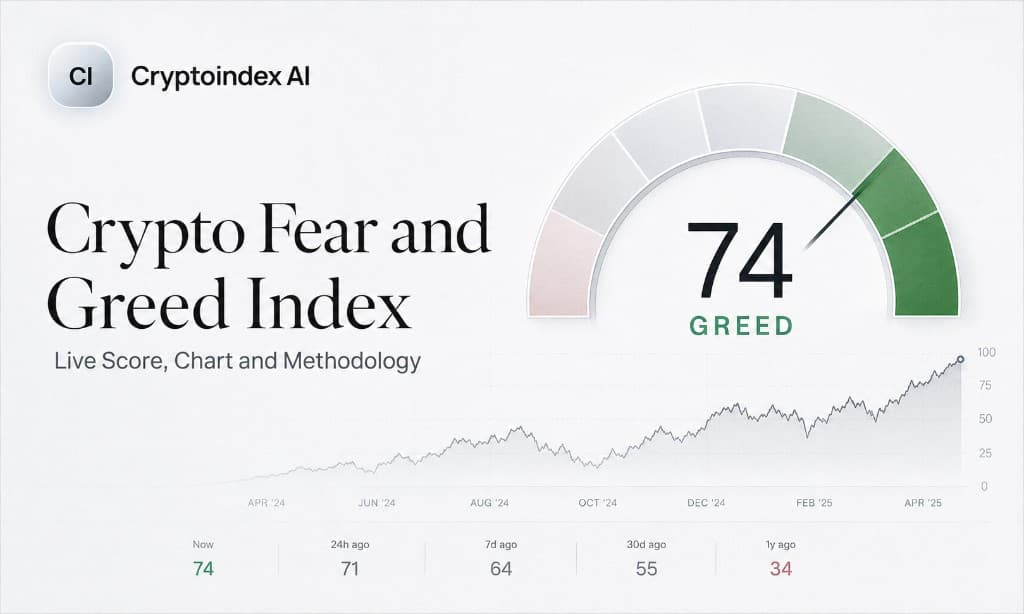
A 0–100 sentiment gauge for crypto. How the score is built, what extreme fear and greed actually mean, and how to read it next to CI100 - not as a trade signal.
The Crypto Fear and Greed Index is a 0–100 sentiment gauge for the digital asset market. A low reading means investors are fearful and may be selling into weakness; a high reading means the market is greedy and possibly overextended. The index does not forecast price. It compresses several measurable market behaviours into one number so you can see how the crowd is positioned relative to its own recent history.
Live score: the Fear & Greed page shows today’s gauge, history, spot Bitcoin ETF flow and Bitcoin dominance.
What the score actually means
The scale is split into bands. Most published versions of the index, including the original one, use these:
| Range | Label | What it typically reflects |
|---|---|---|
| 0–24 | Extreme fear | Sharp drawdown, elevated realised volatility, thin bid-side depth |
| 25–49 | Fear | Prices below recent averages, muted search and social activity |
| 50–54 | Neutral | Range-bound tape, no dominant sentiment signal |
| 55–74 | Greed | Momentum above trend, rising retail participation |
| 75–100 | Extreme greed | Parabolic moves, funding rates stretched, search interest spiking |
The bands are descriptive, not prescriptive. A reading of 12 tells you the market is scared. It does not tell you the bottom is in, and it never has.
How the index is calculated
The original index, published by Alternative.me since February 2018, blends several inputs into a single daily figure. The weighting has been stable for years:
Volatility - 25%. Current bitcoin volatility and maximum drawdown are compared with 30-day and 90-day averages. An unusual rise in volatility is treated as a sign of a fearful market.
Market momentum and volume - 25%. Current volume and market momentum are measured against their own 30-day and 90-day averages. Persistently high buying volume in a rising market pushes the score toward greed.
Social media - 15%. Interaction rates on crypto-related posts on X are tracked against baseline. Unusually high engagement is read as growing public interest, which the model treats as greed.
Dominance - 10%. Rising bitcoin dominance is interpreted as fear: capital rotating out of speculative altcoins into the market's reserve asset. Falling dominance suggests risk appetite is returning.
Google Trends - 10%. Search volume for bitcoin-related queries, with attention paid to which queries are rising. A spike in searches like "bitcoin price manipulation" reads very differently from a spike in "buy bitcoin".
Surveys - 15%. This component was part of the original design but has been paused for years. The remaining factors are rescaled to fill the gap.
Other providers publish their own versions. CoinMarketCap's index uses a different factor mix and typically prints a different number on the same day. That is expected - there is no single canonical Crypto Fear and Greed Index, only a family of related sentiment models. When you compare readings across sites, compare the trend, not the level.
Why the numbers differ across sites Two indices can both be "correct" and disagree by fifteen points. They sample different exchanges, weight volatility differently, and normalise over different lookback windows. Pick one source and stay with it. Switching between providers mid-analysis introduces noise that has nothing to do with the market.
Reading the index without fooling yourself
The index is a contrarian tool by design, and contrarian tools fail in exactly one way: they fire early and keep firing.
Extreme fear is not a buy signal. It is a description of conditions in which historically favourable entries have sometimes appeared. In the March 2020 collapse the index sat in extreme fear for weeks while price fell another 40%. In the 2022 bear market it printed single digits repeatedly across a downtrend that lasted the better part of a year. Anyone treating each print as an entry was averaging into a falling market with no risk framework.
Extreme greed is not a sell signal either. Sustained readings above 75 are a normal feature of strong bull phases. Exiting on the first extreme greed print in a genuine trend means missing most of it.
Duration matters more than the level. A single day at 18 is noise. Three consecutive weeks below 25 describes a different market state entirely - one where forced selling has usually already happened. Look at the shape of the series, not today's dot.
Divergence is the interesting part. When price makes a lower low but the index makes a higher low, the crowd is less scared than it was at the previous low. That mismatch between price and positioning is where the gauge earns its keep. The same works inverted at tops.
What the index does not measure
Being explicit about the gaps is more useful than another paragraph on how to use it.
It is bitcoin-centric. Volatility, dominance and search inputs are built around BTC. During periods when capital rotates hard into altcoins, the index can read neutral while a large part of the market is behaving euphorically. Pair it with the Altcoin Season Index to see that half of the picture.
It has no derivatives inputs in the original construction. Funding rates, open interest and options skew are among the cleanest positioning data in crypto, and they are absent. A market can be dangerously levered while sentiment reads calm.
It is not a volatility forecast. For a forward-looking read, look at implied volatility measures rather than this gauge.
It does not scale with market size. A 15% drawdown in 2018 and a 15% drawdown in 2026 produce comparable index behaviour despite vastly different market structure, participant mix and institutional flow.
Using it alongside index data
Sentiment is one layer. On its own it tells you how people feel; it does not tell you what the market is actually doing underneath. Three pairings that add information:
Fear & Greed plus a broad benchmark. Compare today's reading with the path of a broad index such as CI100. Sentiment at 20 while the broad index is flat over 30 days is a very different setup from sentiment at 20 after a 35% index drawdown.
Fear & Greed plus dominance. The index already includes dominance at 10% weight, but the raw series carries more detail. A falling Bitcoin dominance reading during a greed phase usually means the alt sleeve is leading. Falling dominance during a fear phase is more often bitcoin underperforming than alts leading.
Fear & Greed plus breadth. How many top-50 names are above their 90-day average? Sentiment at 70 with narrow breadth, two or three megacaps carrying the tape, is a fragile arrangement that the single number cannot show you.
Historical behaviour
The full history (90D / Year / All) is on the Fear & Greed page. A few patterns hold up across the index's history since 2018.
Readings below 10 are genuinely rare. They cluster around specific liquidation events rather than appearing throughout ordinary bear markets. When they do appear, they tend to arrive in tight groups over days, not spread evenly across a downtrend.
Readings above 90 are similarly rare and cluster near local tops, but the lag between the first print above 90 and the eventual peak has ranged from days to several months. The gauge has never been useful for timing exits precisely.
Long stretches in the 40–60 band are the most common state and the least informative. Roughly speaking, the index is uninteresting most of the time and occasionally very interesting, which is the correct behaviour for a sentiment extreme detector.
Frequently asked questions
Who publishes the Crypto Fear and Greed Index? The best-known version is published by Alternative.me and has run daily since February 2018. CoinMarketCap, CFGI and several other providers publish their own variants with different factor mixes. Cryptoindex.ai shows the live series next to our own index data so you can compare sentiment with actual index performance on one screen.
Is there a separate bitcoin fear and greed index? In practice the crypto index and the bitcoin index are the same thing. The original construction takes most of its inputs from bitcoin data, so the two names refer to the same gauge.
How often does it update? Daily for the original index. Our live page updates on the same schedule and keeps the historical series.
Is a low reading a good time to buy? Historically, extreme fear readings have often preceded strong multi-month returns - and have also appeared repeatedly during declines that continued for a long time afterwards. The index is a description of sentiment, not a trade signal, and it carries no information about position sizing or risk.
Where is the live gauge? On the Crypto Fear and Greed Index Today page, with history, ETF flow and Bitcoin dominance.
Bottom line
The Crypto Fear and Greed Index is a compression tool. It takes volatility, momentum, dominance, social activity and search interest and hands you one number that answers a narrow question: how is the crowd feeling relative to its own recent norm? That question is worth asking, and the answer is worth about as much as any single indicator ever is - which is to say, meaningful in context and misleading in isolation.
Use it as one input beside actual index performance, breadth, and dominance. Watch the shape of the series rather than the daily print. And remember that the market can stay fearful, or greedy, considerably longer than the position you built on that reading can stay open.
Cryptoindex.ai publishes index data and market analysis for informational purposes. Nothing on this page is investment advice.