Market Structure · Oct 7, 2026
Stablecoin Market Share in Q4 2026: What the Data Says About Crypto Liquidity
Market StructureDominanceStablecoins

Stablecoin dominance is 10.52%, a one-year high. Supply is still about $309 billion. The ratio rose because the rest of the market shrank.
Updated 7 October 2026 with Q4 figures.
Stablecoin dominance entered the fourth quarter of 2026 at 10.52%, the highest reading in about a year. The usual interpretation of that is straightforward and wrong: a pile of cash is building up on the sidelines, waiting to buy.
Check the other series and the picture inverts. Total stablecoin supply is $309 billion, which is roughly where it was at the start of the year. Almost no new money has arrived. What changed is the denominator: total crypto market capitalization is $2.94 trillion, down 30.81% year over year.
Run the arithmetic on that. If today's $309 billion of stablecoins had been sitting there a year ago, against a market of roughly $4.25 trillion, it would have been about 7.3% of the total. The same dollars, untouched, are now 10.5%.
Stablecoin dominance rose by more than three percentage points without a single additional stablecoin being minted.
That gap between what the ratio appears to say and what it actually measured is the subject of this piece, and it is the reason we argue that stablecoin dominance is the only dominance ratio worth tracking at all: it is the only one with a numerator that tracks capital rather than price. Which also makes it the one most often misread.
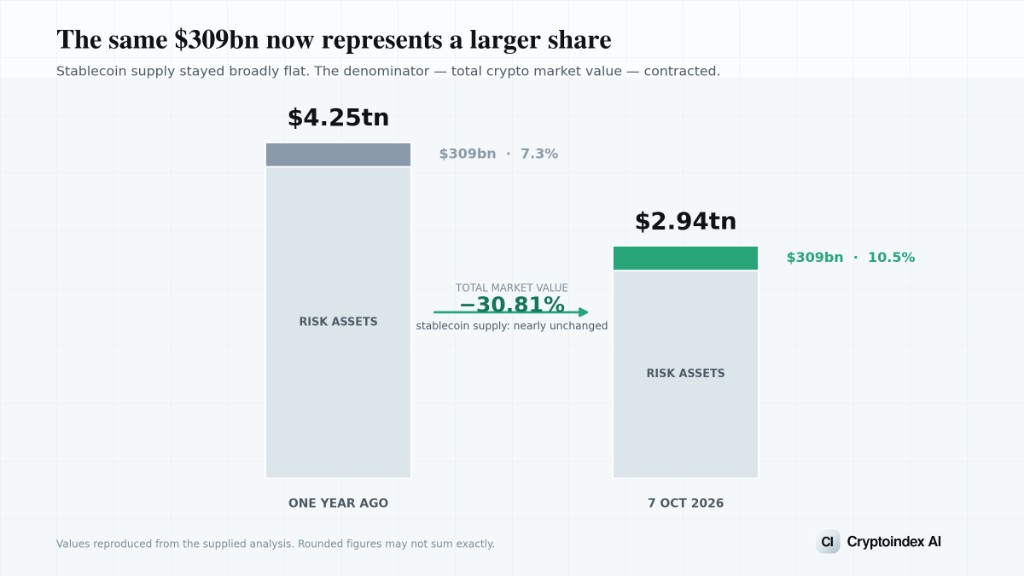
Where it stands entering Q4 2026
| Reading | As of | |
|---|---|---|
| Total crypto market cap | $2.94tn, down 30.81% year over year | 7 Oct 2026 |
| Total stablecoin supply | $309bn, broadly flat through 2026 | 7 Oct 2026 |
| Stablecoin dominance | 10.52% | 7 Oct 2026 |
| Same supply, one year ago's market | ~7.3% | derived |
| Bitcoin market cap | $1.68tn | 7 Oct 2026 |
| Headline bitcoin dominance | 57.37% | 7 Oct 2026 |
| Bitcoin dominance excluding stablecoins | ~64.1% | derived |
| Fear and Greed Index | 41, Fear, down from 72 in early October | 7 Oct 2026 |
Two things follow from that table, and they point in opposite directions.
The bearish reading is that the dry powder everyone talks about has not been topped up. Stablecoin supply did not grow through a year in which the market lost nearly a third of its value. If capital were queuing to come back in, the usual first sign is new issuance, and it is not there.
The constructive reading is that the pool also did not shrink. There were no mass redemptions. Dollars that entered crypto have largely stayed inside it, parked rather than withdrawn. That is a different thing from capitulation, where supply falls because people take the money home.
Flat supply during a 30% drawdown is a genuinely unusual configuration, and it is the single most interesting fact in this quarter's data.
The formula, and what sits inside it
Stablecoin dominance is the combined market capitalization of all stablecoins divided by total crypto market capitalization.
One caveat belongs up front rather than in a footnote. Different trackers count different universes, so the exact print varies by a percentage point or more between sources. One widely used stablecoin tracker put the aggregate at $303.6 billion on 1 October against CoinGecko's $309 billion. The direction of travel is reliable. The second decimal place is not.
What makes up the numerator is far more concentrated than the phrase "the stablecoin market" suggests:
| Stablecoin | Market cap | Share of stablecoin supply |
|---|---|---|
| USDT (Tether) | $183.8bn | 60.55% |
| USDC (Circle) | $74.1bn | 24.40% |
| USDS (Sky) | $9.92bn | 3.27% |
| USDe (Ethena) | $4.90bn | 1.61% |
| DAI (Sky) | $4.60bn | 1.51% |
Issuer shares as of early October 2026. These move slowly.
Two issuers account for just under 85% of the entire stablecoin market. And of 307 tracked stablecoins, the 35 above $100 million represent 98.98% of total supply, leaving the other 272 to share roughly one percent between them.
If you have read our work on index construction, that distribution should look familiar. It is the same long tail that makes a cap-weighted top-100 index behave like a top-10 index. Counting names tells you nothing. Counting weight tells you everything.
The part that trips people up: two engines, one ratio
Stablecoin dominance is a fraction, and a fraction can move for two completely different reasons. Almost all bad analysis of this metric comes from confusing them.
Engine one: the numerator. Stablecoins are minted and redeemed. When money enters crypto from the banking system it usually arrives as a stablecoin mint, and when it leaves it usually exits as a redemption. This is the engine people think they are watching. It genuinely measures capital flow.
Engine two: the denominator. Everything else is priced continuously. If the rest of crypto falls 20% and not a single new stablecoin is issued, stablecoin dominance rises sharply. Nothing was bought. Nothing was sold into cash. The ratio moved because the other side of the fraction shrank.
In practice the second engine does most of the work, which is why "stablecoin dominance is spiking, buyers are loading up" is usually wrong. During a drawdown, stablecoin dominance spikes mechanically. The Q4 2026 reading at the top of this article is exactly that case.
The fix is simple and almost nobody does it: look at absolute stablecoin supply alongside the ratio. Two series give you four readings, and the common commentary collapses all four into one.
- Ratio up, supply up. Real money entered and is sitting in cash. The genuine dry-powder signal.
- Ratio up, supply flat. Prices fell. The ratio is an artefact. This is where we are now.
- Ratio down, supply up. Money entered and went straight into risk. The strongest risk-on reading available.
- Ratio down, supply down. Capital is leaving the asset class entirely. The one to actually worry about.
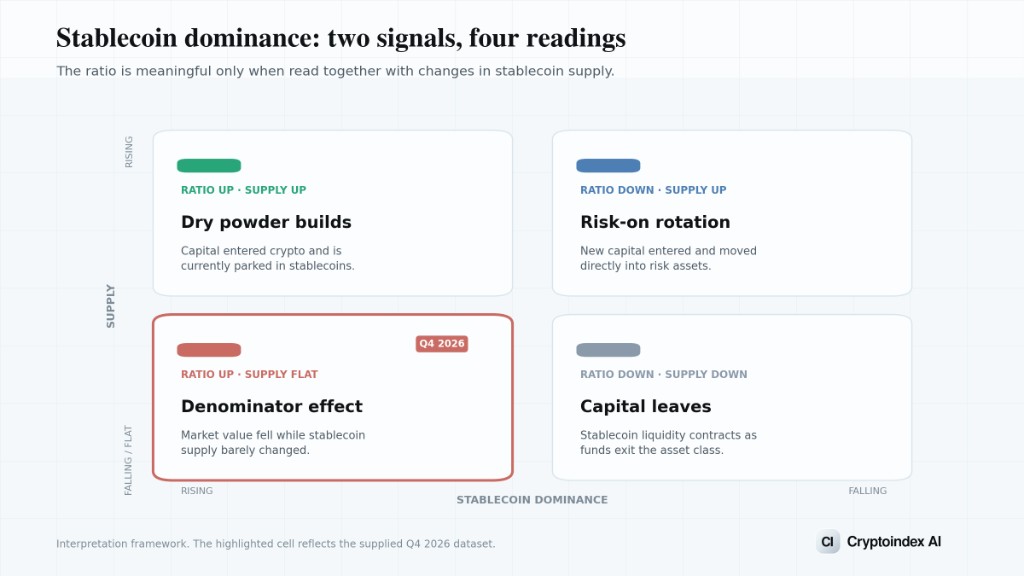
What it does to every other dominance number
Back to the distortion in the opening, because stablecoin dominance is not only a reading in its own right. It sits inside every other dominance figure as an error term.
As of 7 October 2026, bitcoin's market capitalization is $1.68 trillion and headline bitcoin dominance prints at 57.37%. Take stablecoins out of the denominator, since a dollar token is not competing with bitcoin for anything, and the same bitcoin in the same market gives:
57.37% ÷ (1 − 0.1052) = ~64.1%
A gap of roughly 6.75 percentage points. That is the distance between "bitcoin is a bit over half of crypto" and "bitcoin is close to two thirds of everything that actually moves". Those two sentences support different conclusions about how diversified this asset class is.
There is a second-order effect specific to this quarter. Because stablecoin dominance has risen, the wedge between headline and ex-stablecoin bitcoin dominance has widened too. A year ago, at roughly 7.3% stablecoin share, the same headline figure would have implied an ex-stablecoin reading about two points lower than it does today. The measurement error is not constant. It grows as the market shrinks.
Which figure is correct depends on your question, and both are defensible:
Include stablecoins if you are measuring the size of the asset class as a whole, including the settlement layer people actually transact in. Stablecoins are a real and growing part of crypto, not an accounting artefact.
Exclude stablecoins if you are measuring relative performance among risk assets. A dominance ratio is supposed to answer "how is bitcoin doing against its competition", and a dollar token is not competition.
The one thing you cannot do is mix them. Comparing a headline figure from one source against an ex-stablecoin figure from another and calling the difference a trend is a mistake we see constantly. We publish both readings on the bitcoin dominance page.
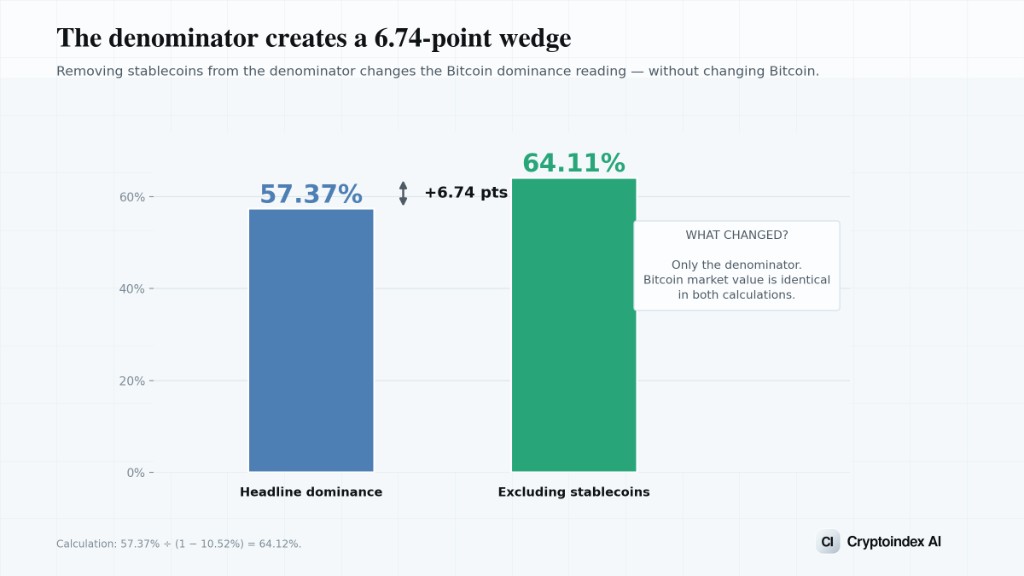
Where stablecoin dominance shows up as an index input
This metric is wired into sentiment indices, which is where it reaches most people without them knowing.
CoinMarketCap's Fear and Greed Index uses the Stablecoin Supply Ratio as one of its five factors, under the heading of market composition. SSR compares bitcoin's market capitalization to stablecoin supply, on the logic that a large stablecoin pool relative to bitcoin represents latent buying power while a small one suggests capital is already deployed.
So when you read a sentiment number, part of what you are reading is this ratio, pre-interpreted by someone else's model. Whether you agree with the interpretation is a separate question from whether you knew it was in there.
The timing is worth noting. The Fear and Greed Index read 41 on 7 October, in Fear territory, having printed 72 in Greed only days earlier. Part of what moved it is a market that fell. Part is the composition inputs shifting underneath, including this one. We take apart all five components in the Fear and Greed methodology breakdown, and publish live readings on the fear and greed page.
The broader point is one we keep running into. A metric that looks like raw data is often an opinion with a formula attached, and the opinion lives in the choices nobody prints on the chart.
The concentration problem
There is a structural issue worth stating plainly, because it rarely appears in dominance commentary.
Just under 85% of stablecoin supply sits with two issuers. The metric called "stablecoin dominance" is, to a first approximation, a measurement of two private companies' balance sheets.
This matters in three ways.
It is not a diversified aggregate. If USDT's supply moves 5%, that is three percentage points of the entire stablecoin market, and it shows up as a move in stablecoin dominance that has nothing to do with market-wide sentiment.
Issuance decisions are not market decisions. Mints and burns reflect an issuer's treasury operations, redemption queues and banking relationships as well as end-user demand. The signal carries institutional noise that a price-derived metric does not.
Concentration is a risk the ratio does not show. The number looks identical whether supply is spread across twenty issuers or two. That is a real difference in the fragility of what is being measured, and the ratio is silent on it.
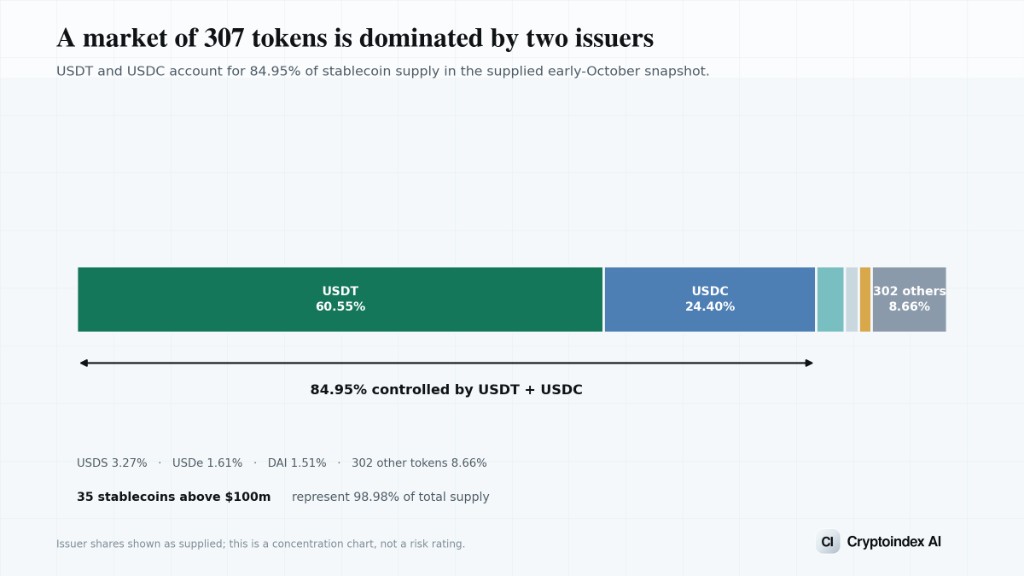
Three regimes, and which one Q4 2026 is
A practical reading guide, assuming you have both series in front of you.
Accumulation. Supply rising, dominance rising, prices soft. Capital is arriving and waiting. This is the setup people mean when they talk about dry powder, and it is the rarest of the three because it requires inflows during weakness.
Deployment. Supply flat or rising slowly, dominance falling, prices rising. Existing cash is moving into risk. The most common pattern during a sustained rally, and it has a natural limit, because the pool is finite.
Exit. Supply falling, dominance ambiguous. Redemptions mean dollars are leaving crypto entirely rather than rotating within it. The dominance ratio is close to useless here, because both halves of the fraction are shrinking.
Q4 2026 is none of these cleanly, and that is the finding. Supply is flat, dominance is rising, and prices have fallen hard. Capital is neither arriving nor leaving. It is sitting still while the asset side revalues around it.
The honest read is that this is a stalemate rather than a signal. Anyone describing the current dominance level as accumulation is reading the ratio without the supply line. Anyone describing it as capitulation is ignoring that redemptions have not happened. The useful thing to watch from here is not the ratio at all. It is whether the supply line breaks flat, in either direction.
What this metric cannot tell you
Four honest limits.
It cannot see intent. A stablecoin balance might be waiting to buy, posted as derivatives collateral, parked in a lending protocol for yield, or in transit between exchanges. The ratio counts all of these identically.
It cannot see geography or purpose. A meaningful share of stablecoin supply functions as dollar access in places where dollar banking is hard to get. That demand has nothing to do with crypto market sentiment and sits in the same number.
It has no threshold. Unlike an index with a documented base date and defined bands, stablecoin dominance has no "high" or "low" level with analytical backing. Anyone quoting a specific percentage as a buy signal is making it up, including treating this quarter's one-year high as one. A record is a fact about a series, not a prediction about a market.
It is slower than it looks. Mints and redemptions clear on issuer timelines, not market timelines. The flow you are reading today may reflect a decision made days ago.
None of which makes it useless. It makes it one input among several, which is how the index providers who use it treat it.
Frequently asked questions
What is stablecoin dominance right now? 10.52% as of 7 October 2026, with total stablecoin supply at $309 billion against a total crypto market capitalization of $2.94 trillion. That is around a one-year high, driven by the market falling rather than by stablecoin supply growing.
What is stablecoin dominance? The combined market capitalization of all stablecoins divided by total crypto market capitalization. It is the only dominance ratio whose numerator tracks capital flow rather than price.
Is rising stablecoin dominance bullish? Not by itself. The ratio rises whenever the rest of the market falls, with no new money involved. Check absolute stablecoin supply at the same time: rising supply alongside a rising ratio is the only version that indicates capital actually arriving. In Q4 2026 supply is flat, so the rise is a denominator effect.
How much has stablecoin dominance risen in 2026? Stablecoin supply has been broadly flat at around $309 billion while the total market fell 30.81% year over year. The same dollar amount that represented roughly 7.3% of the market a year ago represents 10.52% today.
Why does stablecoin dominance affect bitcoin dominance? Stablecoins sit in the denominator of the bitcoin dominance calculation. At the current 10.52% stablecoin share, excluding them raises bitcoin dominance from a headline 57.37% to roughly 64.1%, a gap of about 6.75 percentage points. The gap widens as stablecoin dominance rises.
What is the Stablecoin Supply Ratio? SSR compares bitcoin's market capitalization to total stablecoin supply, and is one of the five factors in CoinMarketCap's Fear and Greed Index. It is a different arrangement of the same two quantities as stablecoin dominance.
Which stablecoins dominate the market? USDT at roughly 60.55% of stablecoin supply and USDC at 24.40%, together just under 85%. Of 307 tracked stablecoins, 35 hold 98.98% of supply.
Is there a stablecoin dominance index I can track? It is a ratio rather than an index in the formal sense: no methodology document, no base date, no administrator. Most data providers publish a chart of it, and figures differ between providers because their universes differ.
The short version
Stablecoin dominance entered Q4 2026 at a one-year high of 10.52%, and the move is almost entirely a denominator effect. Supply is flat at $309 billion. The market fell 30.81% over the year. The same dollars that were 7.3% of crypto a year ago are 10.5% today.
Watch it as a pair. Supply tells you whether capital arrived. The ratio tells you where it sits relative to everything else. One without the other produces confident nonsense, and most of what gets written about this metric is exactly that.
And remember what is inside the number. Just under 85% of it is two issuers, the bottom 272 tokens are a rounding error, and roughly 6.75 points of bitcoin dominance are hiding behind it.
Live dominance readings, including the ex-stablecoin version, are on the bitcoin dominance page.
Market figures from CoinGecko as of 7 October 2026. Stablecoin issuer shares from public stablecoin supply trackers, early October 2026; totals differ between providers because their tracked universes differ. Year-ago comparison derived from CoinGecko's stated year-over-year change in total market capitalization. Cryptoindex.ai publishes display indices for informational purposes. They are not funds, licensed benchmarks or investable products. Nothing here is investment advice.