Indices · Nov 5, 2026
The Live Crypto Index Reads 17,808, 3,579 and 2,285 Right Now. Six Reasons, Not One Error.
 Roman Wiligut· Analyst and AI ResearcherIndicesCCi30


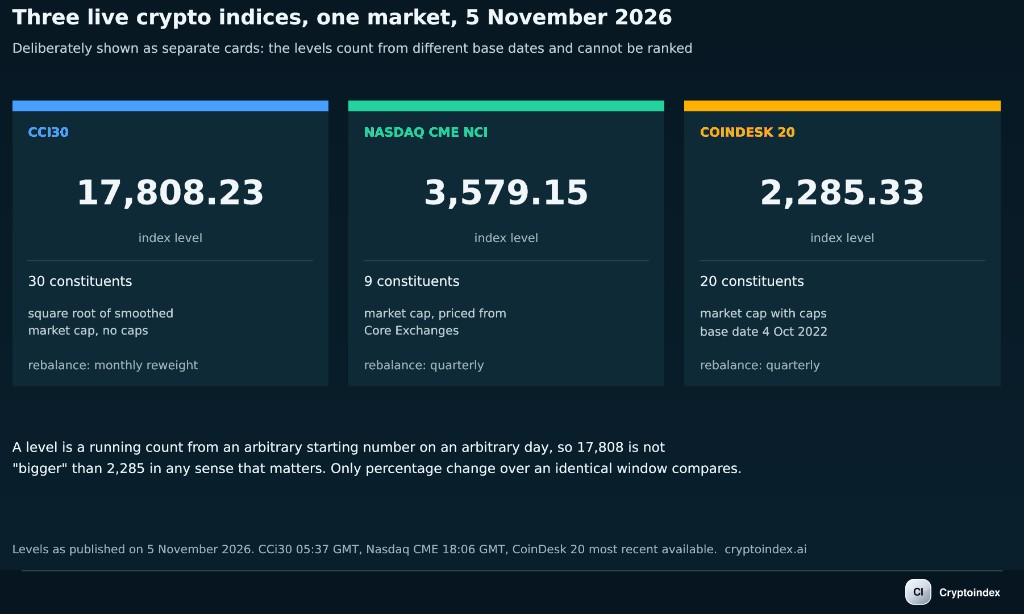
On 5 November 2026 CCi30 reads 17,808.23, the Nasdaq CME index 3,579.15 and the CoinDesk 20 reads 2,285.33. Six published decisions explain the gap.
The Live Crypto Index Reads 17,808, 3,579 and 2,285 Right Now. Six Reasons, Not One Error.
You wanted the live crypto index. Here it is, on the afternoon of 5 November 2026.
The CCi30 reads 17,808.23. The Nasdaq CME Crypto Index reads 3,579.15. The CoinDesk 20 reads 2,285.33.
Same market. Same day. A spread of 7.8x between the highest and lowest number on the screen.
None of them is wrong, and none is more official than the others. The gaps are not errors and they are not noise. They come from six decisions each provider made and published, and once you know which six, you can read any live index number correctly in about ten seconds.
Here they are, in the order they hit the number.
The six, at a glance
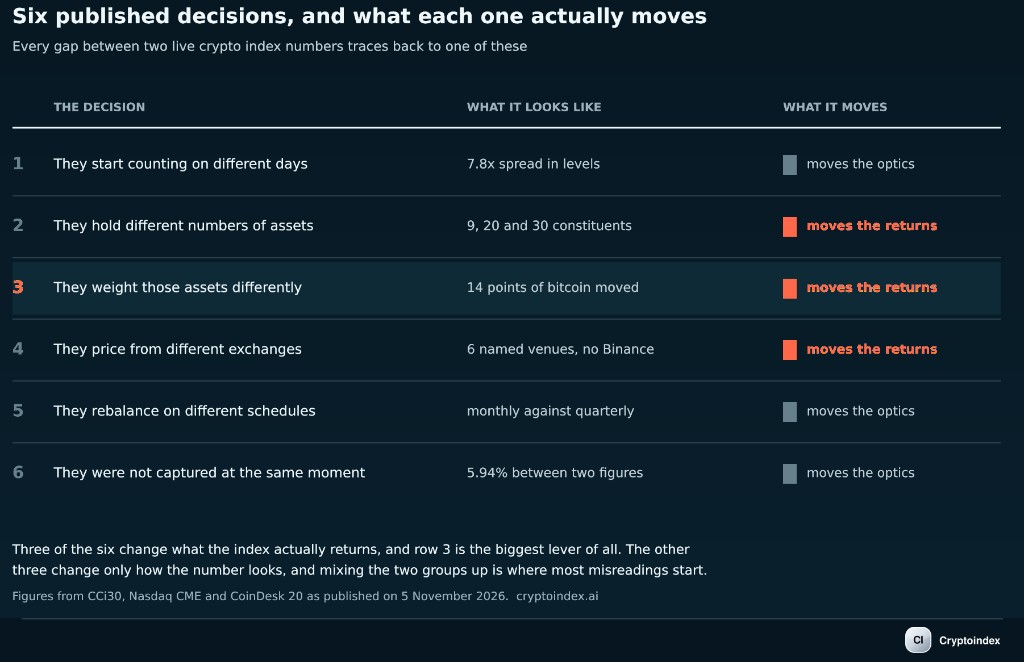
- They start counting on different days. This alone explains the 7.8x spread in levels, and it means the levels cannot be compared at all.
- They hold different numbers of assets. Nine, twenty and thirty, across three indices that all call themselves broad.
- They weight those assets differently. The biggest lever by far. Square-root weighting cuts bitcoin's share by about 14 percentage points against plain cap weighting.
- They price from different exchanges. A short, named list per index, not the whole market.
- They rebalance on different schedules. Monthly versus quarterly, so a live number is today's prices on slightly stale weights.
- They were not captured at the same moment. The Nasdaq index moved 5.94% between two published figures a day apart.
Reasons 2, 3 and 4 move the returns. Reasons 1, 5 and 6 mostly move the optics. Mixing the two groups up is where most misreadings start.
1. They start counting on different days
The first thing to do with a live index level is ignore it.
An index level is not a price. It is a running count that starts at an arbitrary number on an arbitrary day and moves with the basket from there. The CoinDesk 20 has a base date of 4 October 2022. CCi30 has run since 2017. Nasdaq's index counts from its own start.
This is the same arithmetic that makes the Dow read in the tens of thousands while the S&P 500 reads in the thousands, with neither saying anything about which market is larger. The divisor absorbs the arbitrary part, and what survives is percentage change.
So 17,808 versus 3,579 versus 2,285 tells you nothing. The only honest comparison between two indices is percentage change over an identical window.
2. They hold different numbers of assets
The Nasdaq CME index holds 9 constituents. The CoinDesk 20 holds 20. CCi30 holds 30.
All three describe themselves as broad measures of the crypto market. One owns more than three times as many things as another. That is a 3.3x range in what the word broad is doing.
The practical effect is concentration. Nine cap-weighted assets in a market where bitcoin is around 60% of total value is close to a bitcoin position with a tail. Thirty assets, weighted the way CCi30 weights them, is something else entirely.
3. They weight those assets differently
This is the biggest lever and the one almost nobody checks.
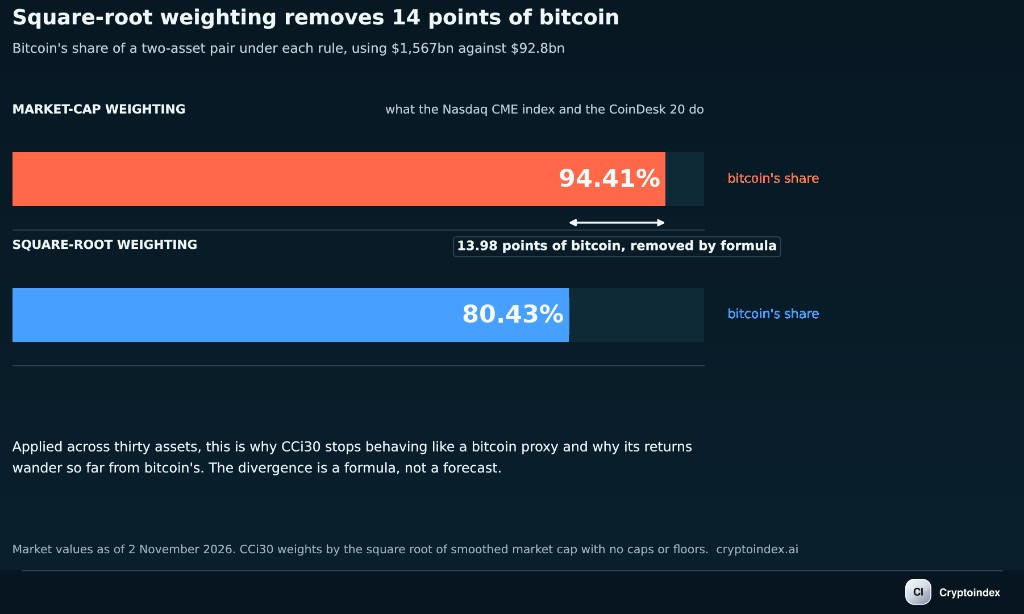
The Nasdaq index and the CoinDesk 20 are market-cap weighted, the second with caps applied. CCi30 does something unusual: it weights each constituent by the square root of its smoothed market capitalisation, with no caps or floors.
That single choice changes the character of the index. Take bitcoin at roughly $1,567bn against an asset at $92.8bn. Under cap weighting, bitcoin takes 94.41% of that pair. Under square-root weighting it takes 80.43%. Nearly fourteen percentage points of bitcoin, removed by a formula rather than by a view.
Scale that across thirty assets and CCi30 stops being a bitcoin proxy in the way a cap-weighted index inevitably is. It is a different bet on the same market, which is why its returns wander so far from bitcoin's. We walked through what each weighting scheme does to an identical basket in our guide to sector and alternative weighting.
4. They price from different exchanges
An index does not take prices from the whole market. It takes them from a named list of venues, and the lists are shorter and more selective than most people assume.
The Nasdaq index prices from six Core Exchanges chosen on governance criteria rather than volume, which is why Binance, the largest venue in the world by spot volume, contributes nothing to it. That turned out to matter during the October hack, which we took apart in our analysis of the Binance failure.
Two indices pricing the same asset from different venues will print different numbers, and the gap widens exactly when it matters most, during stress.
5. They rebalance on different schedules
CCi30 reweights monthly and reviews membership quarterly. Most broad indices reconstitute quarterly.
Between reweights the basket drifts with prices, so a live number is always today's prices run through a slightly stale set of weights. The staleness is deliberate rather than careless, because constant reweighting would mean constant turnover and constant cost.
The consequence is that two indices can hold similar assets and still diverge for weeks purely because one rebalanced last Tuesday and the other has not since September.
6. They were not captured at the same moment
The word live covers a range of behaviours, and a screenshot without a timestamp is not evidence of anything.
The Nasdaq CME index closed at 3,805.08 on 4 November and was reading 3,579.15 by the evening of 5 November, a move of 5.94% inside roughly a day. Both figures are published and both are correct. Quoting one against the other as though they were the same moment would manufacture a crisis that did not happen.
A comparison between two indices needs both timestamps to match. Most of the comparisons you will see circulating do not.
What the six add up to
None of this is academic. Here is CCi30 against bitcoin, over the windows the provider publishes.
| Period | CCi30 | Bitcoin |
|---|---|---|
| Month to date | +2.70% | |
| Year to date | -11.67% | -8.08% |
| 52 weeks | -24.17% | |
| 3-year annualised | +16.05% |
So on 5 November 2026 the honest answer to "how is crypto doing" is that the broad market is down about 11.7% this year while bitcoin is down about 8.1%. Both are true. The 3.6-point difference between them is not a market fact. It is reasons 2 and 3 showing up as a number.
If you quote the broad index at someone holding bitcoin, you are describing a portfolio they do not own.
The four-year pattern, and the test that breaks it
Here is where a plausible story falls apart under one check.
CCi30 publishes its calendar-year returns next to bitcoin's.
| Year | CCi30 | Bitcoin | Gap, points |
|---|---|---|---|
| 2023 | +106.64% | +155.42% | 48.78 |
| 2024 | +78.36% | +121.05% | 42.69 |
| 2025 | -26.75% | -6.34% | 20.41 |
| 2026 YTD | -11.71% | -8.08% | 3.63 |
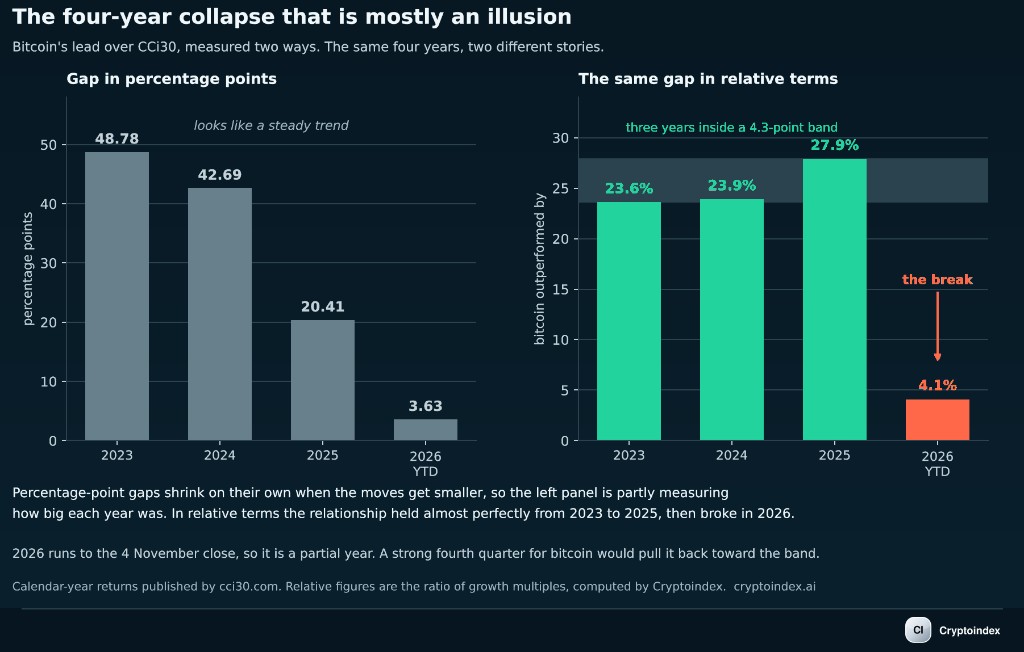
Read the last column and the story writes itself. Bitcoin's lead collapsed steadily for four straight years, from nearly 49 points to under 4. The market is broadening.
That story is mostly wrong, and the mistake behind it is everywhere.
Percentage-point gaps shrink automatically when the moves get smaller. In 2023 both numbers were triple digits, so the gap had room to be enormous. In 2026 both are single-digit negatives, so the gap is physically constrained to be small. That column is partly measuring how big each year was, not how differently the two things behaved.
The fix is to compare them in relative terms: how much one multiplied your money against the other.
| Year | Bitcoin outperformed by |
|---|---|
| 2023 | 23.6% |
| 2024 | 23.9% |
| 2025 | 27.9% |
| 2026 YTD | 4.1% |
That changes the conclusion entirely. For three consecutive years, across a doubling, another doubling and a bad drawdown, bitcoin beat the square-root-weighted broad index by between 23.6% and 27.9%. A spread of 4.3 points across three wildly different markets, which is about as stable as anything in this asset class gets.
Then 2026 breaks it, falling to 4.1%.
So the real finding is not a gentle four-year trend. It is three years of a remarkably constant relationship followed by one sharp break, and the break is happening now. A trend invites you to extrapolate. A break invites you to ask what changed.
The honest caveat: 2026 is a partial year, measured to the 4 November close. A fourth quarter that goes bitcoin's way would pull the ratio back toward the historical band.
The quarter the index won
One more data point, pointing the same way.
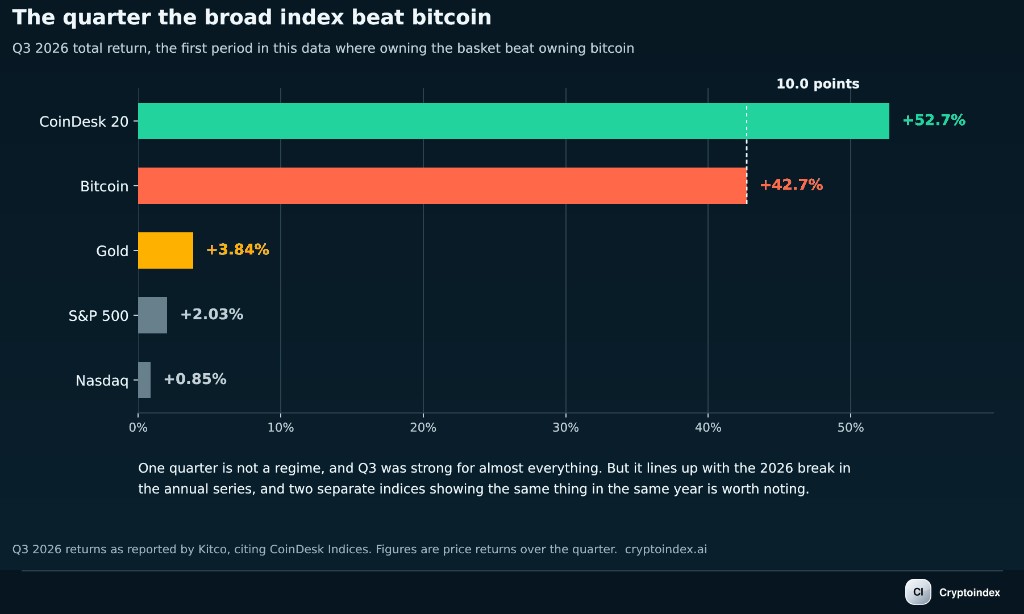
In the third quarter of 2026 the CoinDesk 20 returned 52.7% against bitcoin's 42.7%. Ten points to the broad index, or about 7% in relative terms. For scale, over the same quarter the S&P 500 returned 2.03%, the Nasdaq 0.85% and gold 3.84%.
That is the first period in any of this data where owning the broad basket beat owning bitcoin. One quarter is not a regime, and Q3 was unusually strong for almost everything. But it lines up with the 2026 break in the annual series, and two independent indices showing the same thing in the same year is worth noting rather than dismissing.
Reading a live index number in ten seconds
The six reasons collapse into four questions you can answer from any index page.
Which index is this? The name matters more than the number. "The crypto index" is not a thing.
How many constituents, and weighted how? This covers reasons 2 and 3, which between them explain most of the divergence you will ever see.
Is this a level or a return? Levels are meaningless across providers and meaningful within one. Comparing two indices requires percentage change over an identical window.
What is it priced from, and when? Reasons 4 and 6. A named venue list and a timestamp, or the comparison is noise.
Live levels, constituent counts, weighting rules and rebalance schedules for every index here sit side by side on the Cryptoindex indices page, with construction detail in our methodology. To see what a different weighting rule would have done to the same thirty assets, rebuild and replay the basket in Cryptoindex Pro. The usual caveat on any backtest holds: no trading costs, every fill at the printed price, and assembled by someone who already knows how the story ended.
The short version is that there is no single live crypto index, and hunting for one is the mistake. There are several, they disagree by construction rather than by error, and the disagreement is the most informative thing on the screen.
FAQ
Why do crypto indices show different numbers? Six published decisions: different base dates, different constituent counts, different weighting rules, different pricing exchanges, different rebalance schedules and different capture times. Weighting and constituent count drive the return differences. Base date drives the level differences.
What is the live crypto index right now? There is no single one. On 5 November 2026 CCi30 reads 17,808.23, the Nasdaq CME Crypto Index reads 3,579.15 and the CoinDesk 20 reads 2,285.33. The levels are not comparable because each counts from a different base date.
Which crypto index is the most accurate? None is more accurate than the others. They measure different baskets under different rules. A nine-asset cap-weighted index tracks bitcoin closely, while a thirty-asset square-root-weighted index deliberately does not.
How is the crypto market doing today? On 5 November 2026 CCi30 is up 2.70% month to date, down 11.67% year to date and down 24.17% over 52 weeks. Bitcoin is down 8.08% year to date, so the broad market is lagging bitcoin by roughly 3.6 points this year.
Why is the crypto index down more than bitcoin? Because broad indices hold assets other than bitcoin, and most of those have done worse recently. Square-root weighting amplifies the effect by cutting bitcoin's share about 14 percentage points below its market share.
Has the gap between bitcoin and the broad index closed? Partly, and more recently than the raw numbers suggest. In percentage points it fell every year from 48.78 in 2023 to 3.63 in 2026. In relative terms it held steady at 23.6% to 27.9% from 2023 to 2025 and only broke in 2026, to 4.1%.
Did any crypto index beat bitcoin in 2026? Yes. In the third quarter the CoinDesk 20 returned 52.7% against bitcoin's 42.7%, a ten-point lead for the broad index. That is the first such period in this data.
Sources
- CCi30 live level, methodology and the calendar-year return table against bitcoin: cci30.com, read 5 November 2026.
- Nasdaq CME Crypto Index level and constituent count: CF Benchmarks and Nasdaq index overview.
- CoinDesk 20 level, constituent count and base date: CoinDesk.
- Q3 2026 returns for the CoinDesk 20, bitcoin, the S&P 500, the Nasdaq and gold: Kitco.
The relative-outperformance figures are ours: the ratio of bitcoin's growth multiple to CCi30's for each year, computed from the published calendar-year returns, included because percentage-point gaps are not comparable across years of very different magnitude.