Market Structure · Oct 19, 2026
Bitcoin Lost About $80 Billion in a Week. Its Dominance Went Up.
 Roman Wiligut· Analyst and AI ResearcherMarket StructureBitcoin


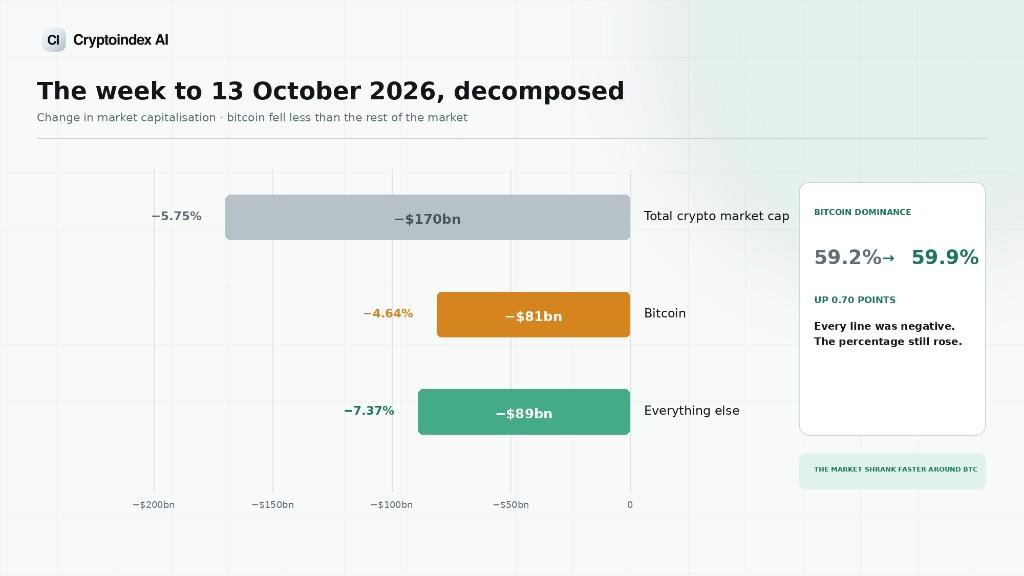
Bitcoin fell 4.64% and lost about $80 billion in the week to 13 October. Dominance still rose, because everything else fell harder.
Bitcoin dominance crossed 60% in the second week of October 2026, and the headlines wrote themselves. Capital rotating back to safety. Bitcoin reclaiming its role as the market anchor. The altcoin trade unwinding.
Here is what actually happened in that week. Bitcoin fell 4.64%. Its market capitalisation dropped by roughly $80 billion. Nobody rotated into anything.
Dominance rose because everything else fell harder: the non-bitcoin half of the market lost about $89 billion, a decline of 7.37%. Bitcoin's share of a shrinking pie got bigger while the slice itself got smaller.
That distinction is the whole article, and it matters because dominance is the single most misread number in this market. It is a ratio. A ratio can rise for two completely opposite reasons, and the chart looks identical either way.
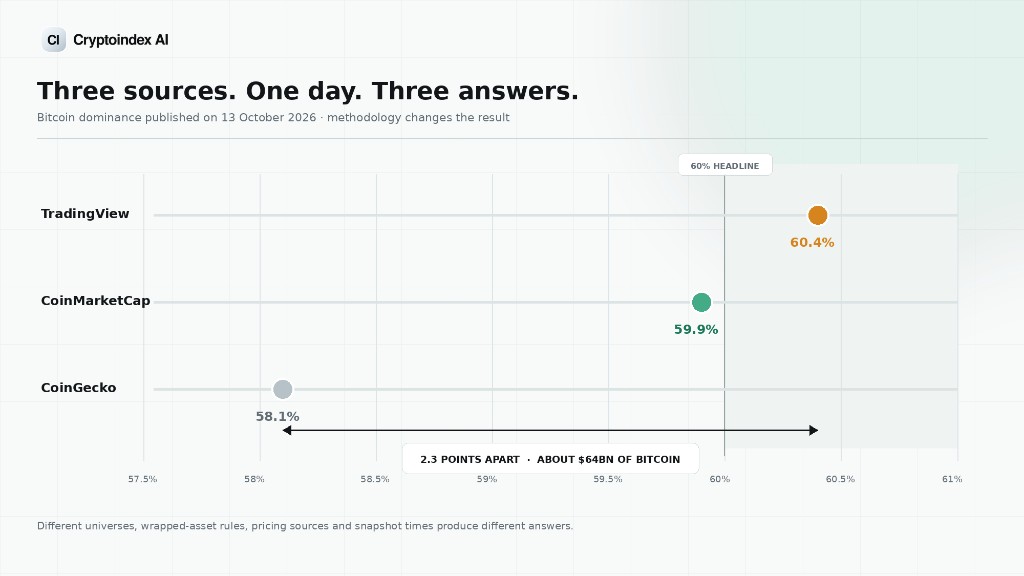
Two more things turned up while checking the arithmetic. Three major providers published three different dominance numbers on the same day, spanning 2.3 percentage points. And the "ex-stablecoin dominance is about 64%" figure now circulating does not reconcile with its own inputs. The correct number is 67.2%.
TL;DR
- Bitcoin dominance rose from 59.2% to 59.9% in the week to 13 October 2026 on CoinMarketCap's basis, and above 60% on TradingView's.
- Bitcoin's own market cap fell by about $80 billion over the same week. The rise in dominance came entirely from altcoins falling faster.
- Had altcoins merely matched bitcoin's decline, dominance would have ended the week unchanged at 59.2%. The entire move is the gap between the two, not a flow into bitcoin.
- Three providers, one day, three numbers: 60.4%, 59.9% and 58.1%. That spread is worth about $64 billion of bitcoin and it decides whether "60%" is a headline or not.
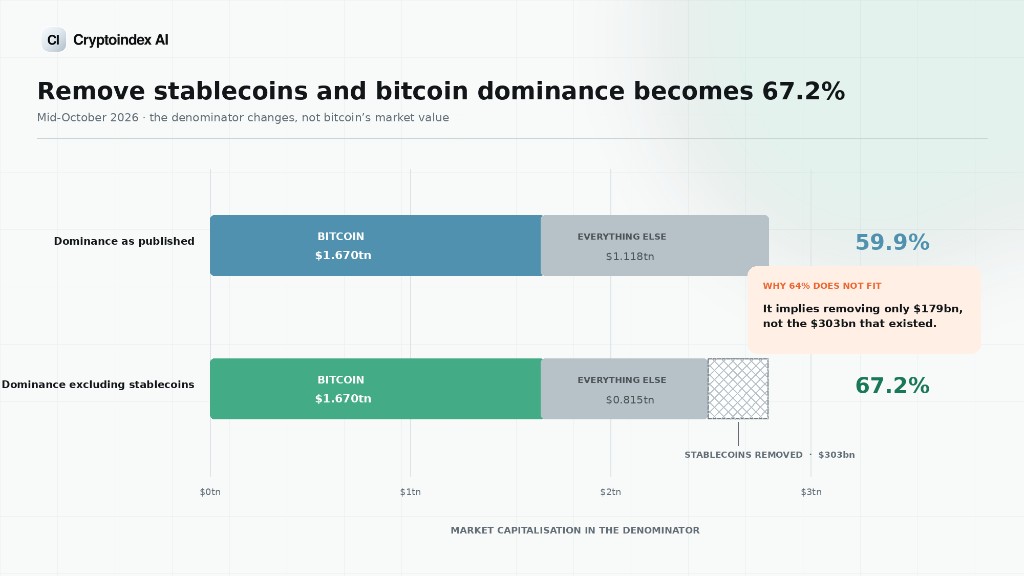
- Ex-stablecoin dominance is 67.2%, not the 64% being quoted. Stripping $303 billion of stablecoins from a $2.788 trillion market cannot produce 64%; we show the working.
- Dominance predicts altcoin seasons less well than it used to, because a growing share of bitcoin's market cap now sits in ETF wrappers held by allocators who do not rotate.
1. The week, decomposed
The raw inputs, all from published sources, for the week to 13 October 2026:
| 6 October | 13 October | Change | |
|---|---|---|---|
| Total crypto market cap | ~$2.958tn | ~$2.788tn | −$170bn (−5.75%) |
| Bitcoin market cap | ~$1.751tn | ~$1.670tn | −$81bn (−4.64%) |
| Everything else | ~$1.207tn | ~$1.118tn | −$89bn (−7.37%) |
| Bitcoin dominance | 59.2% | 59.9% | +0.70pp |
Bitcoin's capitalisation and the dominance readings are as reported. The week-earlier figures are reconstructed from bitcoin's published price move over the period and the reported dominance, which is why they carry a tilde. The direction and the magnitude are not in doubt; the second decimal place is.
Now the individual price moves over roughly the same window, from 5 to 12 October:
| Asset | 5 Oct | 12 Oct | Change |
|---|---|---|---|
| Bitcoin | $85,771 | $81,795 | −4.64% |
| BNB | $786.39 | $732.31 | −6.88% |
| Ether | $2,710 | $2,446 | −9.74% |
| XRP | $1.51 | $1.34 | −11.26% |
| Solana | $120.76 | $105.64 | −12.52% |
| Dogecoin | $0.0954 | $0.0822 | −13.84% |
Every single asset fell. Bitcoin fell least. That is the entire mechanism behind the dominance move, and it is worth stating plainly because the usual commentary around a dominance breakout implies something else entirely.
2. The counterfactual that settles it
If you want one test that separates "money moved into bitcoin" from "bitcoin fell less", run the counterfactual.
Take the actual starting point, apply bitcoin's actual return of −4.64% to both bitcoin and everything else, and see where dominance lands.
It lands at 59.20%. Exactly where it started.
So the whole of the 0.70 point move is attributable to the gap between bitcoin's decline and everyone else's. None of it requires a single dollar to have moved from an altcoin into bitcoin. Dominance would have printed the same number if every holder in the market had sat completely still and simply watched prices move.
This is not a technicality. It changes what the signal means.
Dominance rising in a rising market does suggest relative preference for bitcoin. Money is arriving and choosing where to go.
Dominance rising in a falling market, which is what October 2026 gave us, mostly measures relative loss. Bitcoin is the thing people sell last, which is a statement about liquidity and conviction, not about allocation.
The two look identical on a dominance chart. They are different market conditions and they tend to resolve differently. We made the same argument about reading index levels in general in our guide to what a crypto index measures: the level is a ratio, and a ratio needs its numerator and denominator read separately before it means anything.
3. Which 60%? There are three answers
While checking the headline, something awkward turned up. On 13 October 2026, the same metric, on the same day, read:
| Source | Bitcoin dominance |
|---|---|
| TradingView | 60.4% |
| CoinMarketCap | 59.9% |
| CoinGecko | 58.1% |
A spread of 2.3 percentage points. Against a $2.788 trillion market, that gap is worth roughly $64 billion of bitcoin, which is not a rounding difference. It is larger than the entire weekly move being reported.
It also decides the story. At 60.4% you have a headline about bitcoin reclaiming 60%. At 58.1% you have a quiet week.
The causes are mundane and all of them are disclosed if you go looking. The universe differs: TradingView's reading was computed against the top 125 cryptocurrencies, while other providers run broader or differently screened sets. Inclusion rules differ on wrapped and bridged assets, which can double count bitcoin held in another form. Pricing sources and snapshot times differ. None of this is malpractice. It simply means "bitcoin dominance" is not one number, and quoting it without naming the source is like quoting a temperature without saying which scale.
The practical rule is the one we apply to every index series: compare like with like, and never mix providers inside a single comparison. If you are measuring a weekly change, use the same source for both ends. A week-on-week move of 0.7 points is smaller than the cross-provider spread, so switching source halfway can invert your conclusion entirely.
4. The ex-stablecoin number being quoted is wrong
A second figure doing the rounds this month is that bitcoin's "real" dominance, stripping out stablecoins, is about 64%. The logic behind the adjustment is sound and we have argued for it ourselves. The arithmetic does not work.
Here is the case for the adjustment first. Dominance divides bitcoin by total crypto market cap, and that denominator includes roughly $303 billion of stablecoins. Stablecoins are dollars in a wrapper. They do not compete with bitcoin for the same allocation and they do not rise and fall on crypto sentiment. Including them in the denominator means every dollar that parks in USDT mechanically reduces bitcoin's measured dominance, even though nothing about bitcoin changed. We worked through the same distortion from the other direction in our analysis of stablecoin dominance.
So the adjusted measure is worth calculating:
Ex-stablecoin dominance = bitcoin market cap ÷ (total market cap − stablecoin supply)
With mid-October figures: $1.670tn ÷ ($2.788tn − $0.303tn) = $1.670tn ÷ $2.485tn = 67.21%
Not 64%. The gap between the raw 59.9% and the adjusted 67.2% is 7.31 percentage points, which is a far bigger correction than the one being reported.
To arrive at 64% from the same starting point, you would have to strip only about $179 billion of stablecoins from the denominator. The actual figure is over $303 billion. So the published number either uses a much narrower stablecoin definition without saying so, or applies the adjustment to a different base, or simply does not reconcile.
We are not claiming 67.2% is the single correct reading of the market. It depends on your stablecoin universe and your total. We are claiming that if you quote an adjusted dominance figure, you have to show the three inputs, because a reader cannot check it otherwise. Ours are above.
5. Why dominance means less than it used to
One structural change deserves a mention, because it affects how much weight this indicator should carry going forward.
The classic use of dominance is as an altcoin season signal. Dominance falls, capital is rotating down the risk curve, altcoins outperform. That model assumes the marginal bitcoin holder is someone who could, and might, sell bitcoin to buy something else.
That assumption is weakening. US spot bitcoin ETFs now hold roughly 7% of global bitcoin supply, a figure cited by BNY's Ben Slavin. Those funds took in around $22 billion during 2025. The holders behind them are retirement accounts, advisor models and allocators working to a mandate. When they decide bitcoin is overweight, they rebalance into equities or bonds. They do not rebalance into Solana.
So a growing slice of bitcoin's market capitalisation is held by people who are structurally outside the rotation the dominance indicator is supposed to detect. Dominance can stay elevated on steady allocator demand while the speculative part of the market does whatever it wants. The signal has not stopped working, but the thing it is measuring has partly changed hands.
The altcoin season index tells the matching story for the same week. It read 56 on 13 October, down from 61 the day before and 62 a week earlier. The index measures the share of the top 100 altcoins, excluding stablecoins, that outperformed bitcoin over the past 90 days. Under 75 is conventionally read as not altcoin season. Ether dominance fell from 11.3% to 10.9% over the week, and the non-bitcoin, non-ether share from 29.5% to 29.1%.
Bitcoin did not win October. It simply lost the least, and in this market that is what a dominance breakout has come to mean.
6. How to read a dominance number in practice
Six checks, in order, before you draw a conclusion from any dominance figure.
- Name the source. 60.4%, 59.9% and 58.1% were all true on 13 October 2026. The number is meaningless without the provider.
- Use one source for both ends of a comparison. The cross-provider spread is larger than most weekly moves.
- Check the direction of the total market. Dominance rising in a falling market is a different signal from dominance rising in a rising market.
- Decompose before interpreting. Did bitcoin's market cap go up, or did everyone else's go down? The chart will not tell you. The two capitalisations will.
- Decide what to do about stablecoins, and say so. Raw and ex-stablecoin dominance currently differ by 7.3 points. Either is defensible. Switching silently between them is not.
- Discount the altseason read. A meaningful share of bitcoin's cap now sits with holders who will never rotate into altcoins.
Live bitcoin dominance, ether dominance and the stablecoin share, with the universe and the calculation documented, are on our dominance page, and the methodology behind our index and dominance series is on the methodology page. If you want to see how a basket built on different inclusion rules would have behaved through this month, you can build and replay one in Cryptoindex Pro. The standing caveat on any backtest applies: no trading costs, every fill at the printed price, and assembled by someone who already knows how the story ended.
FAQ
What is bitcoin dominance? Bitcoin's market capitalisation divided by the total market capitalisation of all cryptocurrencies, expressed as a percentage. It measures bitcoin's share of total crypto market value, not its price and not money flowing into it.
What is bitcoin dominance in October 2026? Around 60%, but the exact figure depends on the provider. On 13 October 2026 TradingView showed 60.4%, CoinMarketCap 59.9% and CoinGecko 58.1%. Dominance rose from roughly 59.2% a week earlier on CoinMarketCap's basis.
Why did bitcoin dominance rise if bitcoin fell? Because dominance is a ratio. Bitcoin fell 4.64% over the week to 13 October, and the rest of the market fell 7.37%. Bitcoin's share of a smaller total got larger. If altcoins had fallen by the same percentage as bitcoin, dominance would have been unchanged.
Does rising bitcoin dominance mean altcoin season is over? Not on its own, and the indicator has weakened. Roughly 7% of global bitcoin supply now sits in US spot ETFs held by allocators who do not rotate into altcoins, so part of bitcoin's market cap is structurally outside the flows dominance is meant to detect. The altcoin season index read 56 on 13 October, down from 62 a week earlier.
What is bitcoin dominance excluding stablecoins? Using mid-October 2026 figures, $1.670tn of bitcoin against a $2.788tn total less $303bn of stablecoins gives 67.2%, about 7.3 points above the raw reading. Figures of around 64% have circulated but do not reconcile with those inputs.
Why do different sites show different bitcoin dominance? Because they use different asset universes, different inclusion rules for wrapped and bridged assets, different pricing sources and different snapshot times. The spread on 13 October 2026 was 2.3 percentage points, worth roughly $64bn of bitcoin.