Index Methodology
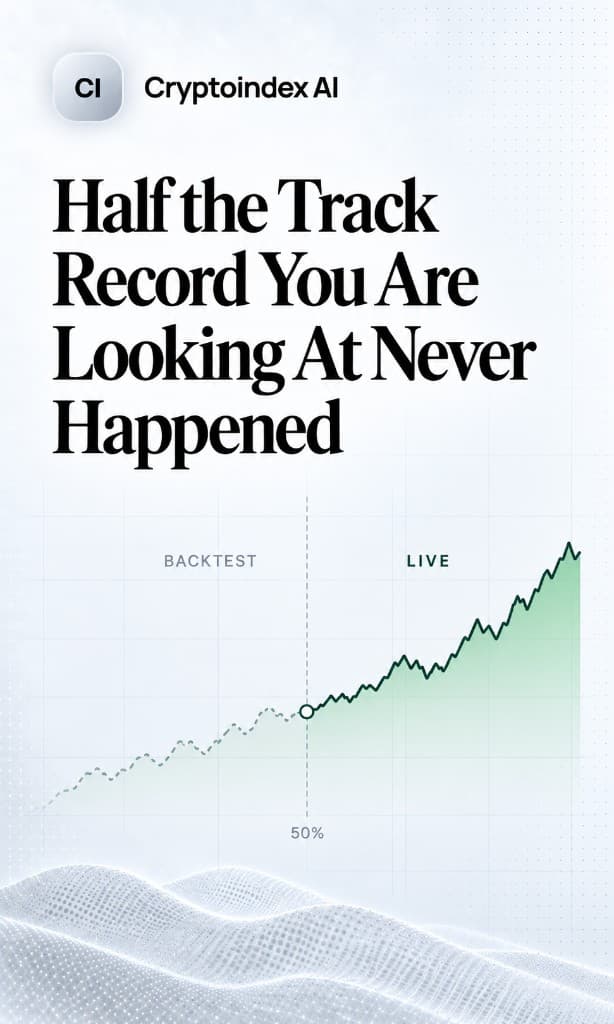
Half the Track Record You Are Looking At Never Happened
 Melanya· Editors & Writers
Index Methodology · Sep 8, 2026
Index MethodologyBacktest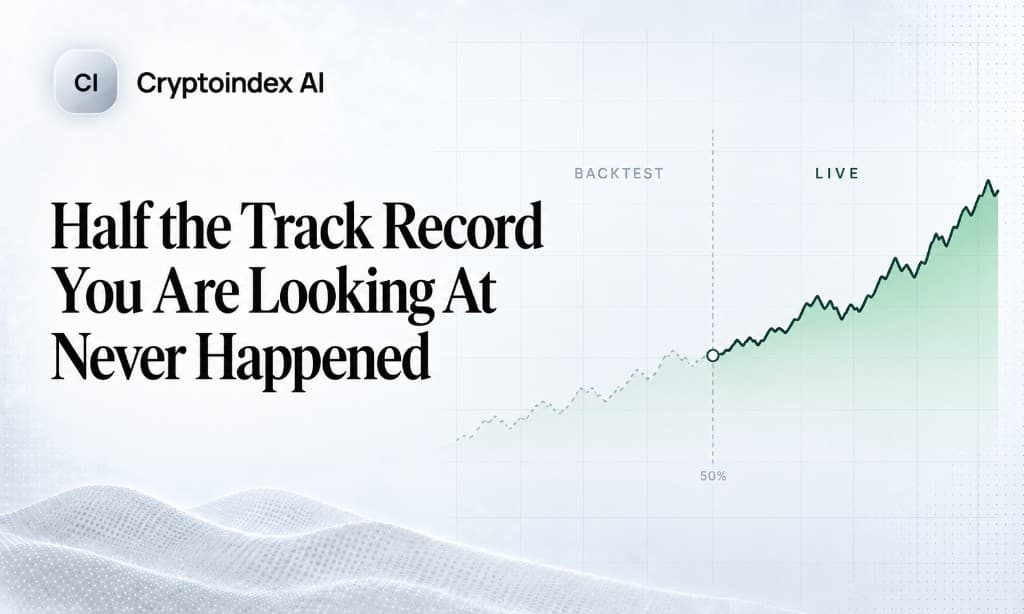
Fifteen months of CoinDesk 20 history existed before the index did. Same line, no marker. How to read base dates, launch dates and backtests - and why the longest chart often belongs to the youngest index.
The CoinDesk 20 launched on 12 January 2024. Its base date is 4 October 2022.
Both of those dates are published, both are accurate, and the gap between them is about fifteen months of index history that existed before the index did. If you pull up a long chart, that stretch looks exactly like the rest of the line. Same colour, same thickness, no marker.
This is completely normal practice and nobody is hiding anything. It is also the single most common way people misread an index chart, and once you know to look for it you will find it almost everywhere.
Three Dates, Not One
Every index has at least three dates and they get collapsed into one in conversation.
Base date. The point where the index is set to its starting value, usually 100 or 1000. Everything is measured from here.
Inception or launch date. When the index actually started being published in real time, calculated live, with the rules fixed in advance.
Backtest start. How far back the provider has reconstructed what the rules would have produced, using historical data.
Values before the launch date are simulated. They are computed by applying today's rules to yesterday's data. The Nasdaq Crypto Index is unusually clear about this: live data begins 2 February 2021, with backtested history reconstructed from 1 June 2020, and the provider states plainly that backtested values are indicative only.
Most charts do not draw the line between those two regimes. The data is continuous, so the picture is continuous.
Why Backtests Flatter
Not because anyone is lying. Because of how the rules got written.
A methodology is designed by people who have already seen the historical data. They know which assets survived, which exchanges failed, which tokens turned out to be frauds. Even with genuine intent to be neutral, the choices about eligibility screens, weight caps and rebalance frequency are made by someone who lived through the period the backtest covers.
Then there is what the backtest cannot include:
Assets that no longer have data. A token delisted from every exchange in 2019 may simply be absent from the historical dataset. If the rules would have held it, and it went to zero, the backtest never feels that.
Execution costs. A live index has funds trading against it, paying spread and market impact at every rebalance in assets that are often thin. A backtest rebalances at a published closing price with no friction at all.
Exchange failures. Prices sourced from a venue that later collapsed still look like prices in a historical database.
None of this makes backtested history useless. It makes it a different kind of evidence: a description of how the rules behave, not a record of what an investor experienced.
The Practical Rule
Live history is evidence. Backtested history is a hypothesis.
Both are worth looking at, for different reasons. A backtest tells you how a rule set behaves across regimes you have data for, which is genuinely informative when you are comparing two methodologies. Live history tells you what actually happened to money.
When comparing two indexes, compare the live portions. If one launched in 2017 and the other in 2024, the honest comparison window starts in 2024, even though both charts go back further and the longer one looks more impressive.
Base Values Are Arbitrary, and That Confuses People Too
While we are on dates, the starting number deserves a mention.
The Nasdaq Crypto Index starts at 1000. CCi30 uses a base of 100 set on 1 January 2015 and now prints in the eleven thousands. Our own CI100 uses a base of 1000 at the first print of its window.
Those numbers mean nothing on their own. An index at 11,000 is not “bigger” or “better” than one at 1,038. It has simply been running from a different starting point for a different length of time.
The only thing an index level tells you is its change since its own base date. Comparing levels across indexes is meaningless. Comparing percentage changes over the same window is the whole exercise.
This sounds obvious written down. It is nonetheless a regular source of confusion, because a four-digit number next to a five-digit number invites a comparison that the numbers do not support.
What to Check on Any Index Chart
Four things, all findable in the methodology document or the fact sheet.
- Where does live calculation begin? Everything before is simulation.
- What is the base date and base value? Needed to interpret the level at all.
- Has the methodology changed since launch? A rule change mid-history means the early part of the live series was produced by different rules than the recent part. Providers do publish this; it just requires looking.
- Does the chart mark any of the above? Usually not. That absence is what makes all of this worth checking manually.
That last one deserves emphasis. A chart is a rendering choice, and the standard rendering choice is a single continuous line. Nothing in the visual tells you that the left half came out of a spreadsheet and the right half came out of the market.
Where This Bites Hardest
Two situations.
Comparing a new index against an old one. New benchmarks launch with long backtested histories precisely because a chart starting last year is unpersuasive. The backtest is doing marketing work whether or not anyone intended it to.
Assessing a fund's strategy. A fund can track an index whose live history is short while presenting the index's full simulated series as context. The fund's own returns are real; the benchmark's early history may not be. Those two things sit next to each other in the same document.
Neither is deceptive. Both are standard. Both require the reader to know which part of the line is which.
The General Version
This is not a crypto problem. Backtested index history is a normal feature of index construction everywhere, and traditional finance has argued about it for decades. Crypto just has an unusually high ratio of simulated to live history, because almost every benchmark in the space is younger than the market it measures.
Which produces the specific situation worth remembering: in crypto, the longest-looking track record often belongs to the youngest index.
When you see a chart that goes back further than you expected, that is the thing to check first.
Base dates, inception dates and methodology notes for each index are on our analysis pages.
Frequently asked questions
What is backtested index history? A reconstruction of what today’s rules would have printed on past prices. It is calculated after the methodology exists. It is not a live record of the index, and it is not what an investor would have earned.
What is the difference between a base date and an inception date? The base date is where the level is set to 100 or 1000. The inception or launch date is when live calculation actually begins. They are often months or years apart, and both can be correct at once.
Can I compare two indexes with different launch dates? Compare the live overlap. If one started in 2017 and the other in 2024, the honest window starts in 2024, even if both charts go back further.
Are backtests useless? No. They show how a rule set behaves across past regimes. They are a hypothesis about the methodology, not evidence of live results. Use them to understand the rules. Use live history to judge what happened to money.
Cryptoindex.ai publishes index data and analysis for informational purposes. Backtested and proxy series are indicative only and do not represent actual investment results. Nothing here is investment advice.