Live Index
Altcoin Season Index
 Alex· Research Analyst at Cryptoindex AI
Altseason · Sep 4, 2026
AltseasonMarket Structure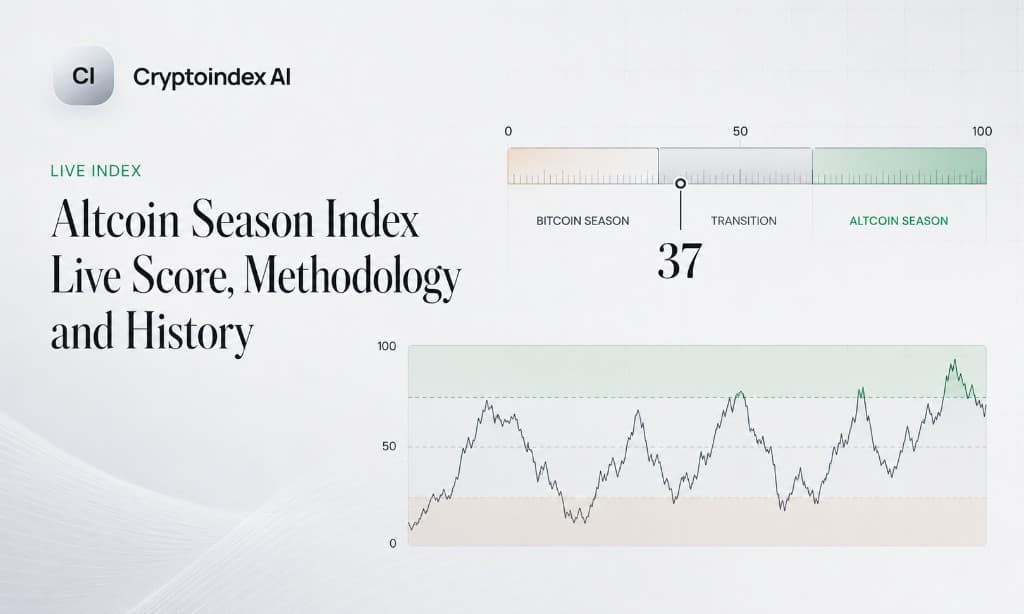
A 90-day breadth count: what share of large alts beat bitcoin. How the score is built, why CMC and Blockchaincenter disagree, and why 75 is a convention - not a buy signal.
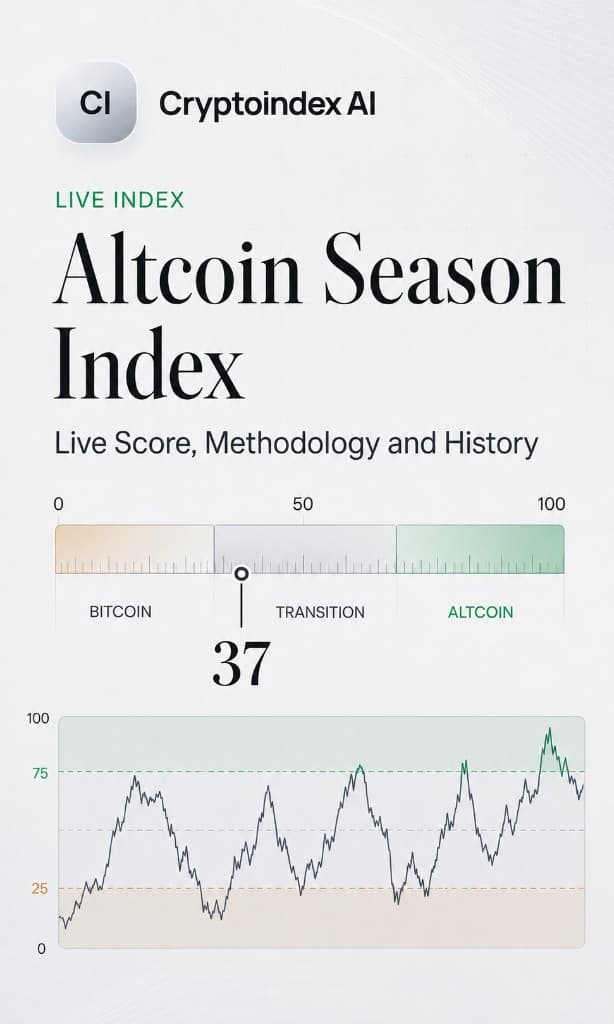
The Altcoin Season Index answers one narrow question: over the past 90 days, what share of large-cap altcoins beat bitcoin? If three quarters of them did, the market is in altcoin season. If a quarter or fewer did, it is bitcoin season. Everything in between is a mixed market, which is where the index spends most of its life.
It is a breadth measure, not a price forecast. It tells you whether a rotation is already happening - not whether one is about to.
How the score is calculated
The original index, published by Blockchaincenter, works like this:
Step 1 - Build the universe. Take the top 50 cryptocurrencies by market capitalisation. Exclude stablecoins such as USDT and USDC, and exclude asset-backed or wrapped tokens such as WBTC and stETH. Those exclusions matter: a wrapped bitcoin token would mechanically track BTC and pollute the comparison.
Step 2 - Measure 90-day returns. Compute the rolling 90-day price return for each remaining coin, and for bitcoin.
Step 3 - Count the winners. Count how many of the coins outperformed bitcoin over that window.
Step 4 - Scale to 0–100. Express that count as a score. When 75% or more of the top 50 beat bitcoin, 38 coins or more out of 50, the index crosses into altcoin season territory. When 25% or fewer beat it, the market is in bitcoin season.
The index refreshes daily.
The calculation funnel
Top 50 by market cap → minus stablecoins → minus wrapped / asset-backed (this is where WBTC and stETH drop out) → 90-day return vs BTC → a 0–100 dial.
Why two sites show different numbers
This confuses people constantly, so it is worth being precise.
CoinMarketCap publishes its own altcoin season index using the top 100 coins rather than the top 50. The exclusions and the 75% threshold are the same. The wider universe pulls in smaller, more volatile names that behave differently from the top 50.
The result is that the two indices routinely disagree. In recent readings, CoinMarketCap’s version has printed in the low 40s while the Blockchaincenter version sat at 57 on the same day - a gap of roughly fifteen points driven entirely by universe size, not by any disagreement about the market.
Neither is wrong. A wider universe measures broader breadth; a narrower one measures large-cap breadth. Pick the one that matches what you actually care about and stop cross-checking against the other, because the difference between them is definitional noise.
Reading the index properly
A rising index is confirmation, not prediction. By construction it looks back 90 days. By the time the score crosses 75, the rotation it describes has already been running for weeks. Traders who treat the crossing as an entry signal are buying the middle or late innings.
The threshold is a convention, not a law. Nothing structural happens at 75. It is a round number chosen because three quarters felt like a reasonable definition of “most.” A market at 71 is not meaningfully different from one at 76.
Breadth is the whole point. The index cannot be moved by two or three big movers. Ethereum and Solana can both double, and if the remaining forty-odd names lag bitcoin, the index stays low. That is a feature - it prevents a narrow rally from being mistaken for a broad one.
Watch the direction of travel. A reading of 45 that came down from 70 describes an exhausting rotation. A reading of 45 that climbed from 20 describes a starting one. The number alone hides which.
The 2026 caveat
Several analysts now treat a high index reading as insufficient on its own and look for confirmation from the ETH/BTC and SOL/BTC pairs. The logic: if the two largest altcoins are not gaining ground against bitcoin, a high breadth reading may reflect speculative churn in smaller names rather than a durable capital rotation. That is a reasonable check, though it is a judgement overlay, not part of the index.
What the index does not tell you
It does not measure size of outperformance. A coin that beat bitcoin by 0.4% counts exactly the same as one that beat it by 300%. Fifty narrow wins and fifty blowouts produce the same score.
It does not measure capital flow. Outperformance in price is not the same as money moving. A thin-liquidity name can outperform on modest volume.
It does not account for new listings. Coins that entered the top 50 recently may not have a clean 90-day history, and how providers handle that is not always documented.
It says nothing about direction. Altcoin season during a broad drawdown means altcoins fell less than bitcoin. That has happened, and it does not feel like a season to anyone holding.
Altseason and bitcoin dominance
The two metrics are close cousins and are often confused.
Bitcoin dominance is a snapshot: bitcoin’s share of total crypto market capitalisation right now. The altcoin season index is a rolling breadth count over 90 days. Dominance can fall because bitcoin dropped while everything else dropped slightly less - which is not a season. Breadth can rise while dominance stays flat if the gains are widely spread but small.
They usually move in opposite directions, and the divergences are where the information sits. Read the two together on the dominance and altseason pages.
Historical pattern
Across the index’s history, altcoin seasons have shown a recognisable sequence. Bitcoin rallies first and pulls attention and capital into the asset class. Bitcoin then stabilises near a local high. Profits rotate outward - first into ether and other megacaps, then progressively down the capitalisation ladder. The index climbs as that rotation broadens.
Extended stretches above 75 occurred during the 2017 and 2021 cycles, coinciding with large rallies in Ethereum and its ecosystem tokens. Sharp drops in the index have generally preceded either a return to bitcoin leadership or a broader market correction.
The 2024–2026 period has looked structurally different from earlier cycles. Spot bitcoin ETFs absorbed a large share of institutional flow directly into BTC rather than into the wider market, and no single dominant altcoin narrative has emerged comparable to the 2017 ICO wave or the 2021 DeFi and NFT boom. The index has spent an unusually long time in the neutral band as a result.
The full history, with the 25 / 75 bands shaded, is on the Altcoin Season page.
The four-stage rotation
Most descriptions of altseason follow this arc. Treat it as a mental model rather than a schedule - cycles rhyme, they do not repeat.
| Stage | Index | Dominance |
|---|---|---|
| Bitcoin leads | 0–25 | Rising |
| Megacaps catch up | 25–50 | Flattening |
| Broad rotation | 50–75 | Falling |
| Long tail runs | 75–100 | Falling fast |
Reversion from stage 4 back to stage 1 is usually abrupt.
Frequently asked questions
What score means it is altcoin season?
75 or above on the standard methodology, meaning at least three quarters of the eligible universe outperformed bitcoin over the trailing 90 days.
Why does the index show a different number on other sites?
Universe size. The original index uses the top 50; CoinMarketCap and several others use the top 100. Same threshold, different sample, different number.
How often does it update?
Daily on all major implementations.
Is a low reading a good time to buy altcoins?
It means altcoins have underperformed bitcoin for three months. Whether that is an opportunity or a warning depends entirely on why, and the index does not carry that information.
How long does altcoin season usually last?
Historically anywhere from about two to six months, though every cycle has run at its own pace and the sample size is small.
Can I embed this index?
The live gauge and chart sit on the Altcoin Season page. Link that page, or reuse the public series next to CI100.
Bottom line
The Altcoin Season Index is a well-built breadth counter with a memorable name. It measures how widely large-cap altcoins are beating bitcoin over a rolling quarter, and it does that job honestly. It is backward-looking by construction, it says nothing about the magnitude of moves, and its 75 threshold is a convention rather than a signal.
Read it alongside bitcoin dominance, a broad benchmark such as CI100, and an alt-only series such as CI-Alts. One number describing the crowd is useful. One number driving decisions is not.
Cryptoindex.ai publishes index data and market analysis for informational purposes. Nothing on this page is investment advice.