AKE Research · Oct 1, 2026
How Derivatives Exposure Drives Forced Market Flows
ResearchAKEDerivativesMarket structure

AKE's squeezes show how a derivatives book larger than the spot market, thin nearby liquidity and short liquidations become forced buying.
Roman Korotchin, co-founder of Origami.tech
AKE drew attention in 2026 because its price repeatedly moved on a scale that seemed disproportionate to the underlying token market.
AKE is the utility token of AKEDO, a multi-agent AI framework that allows creators to build games using natural language prompts. AKE is used for AI creation, staking, and liquidity provision within the ecosystem. Its total supply is 100 billion tokens released under a four-year allocation and vesting schedule.
The token experienced several extreme moves during 2026. On July 15, an AKE perpetual futures contract on Binance rose as much as 304.9% from the recorded event baseline and finished 252.6% higher. EdgeDepth, a market data and historical event research service that archives order book, trade, liquidation, and positioning data, classified the six-hour episode as a short squeeze because 91% of observed liquidations were on the short side.
A short squeeze occurs when a rising market pressures traders holding short positions, which profit from falling prices. Some shorts close voluntarily while others are liquidated when their margin becomes insufficient. Both processes create buy orders in the derivatives market and can add further upward pressure.
AKE experienced another major squeeze in September. EdgeDepth recorded a 315.3% peak move from its September 17 baseline, a 204.8% net gain, $4.9 million in reported liquidations and $1.33 billion in trading volume over the episode. Short positions represented 85% of the observed liquidations. EdgeDepth describes this classification as an observation of the recorded market event and separates it from any claim about who initiated the move or its ultimate cause.
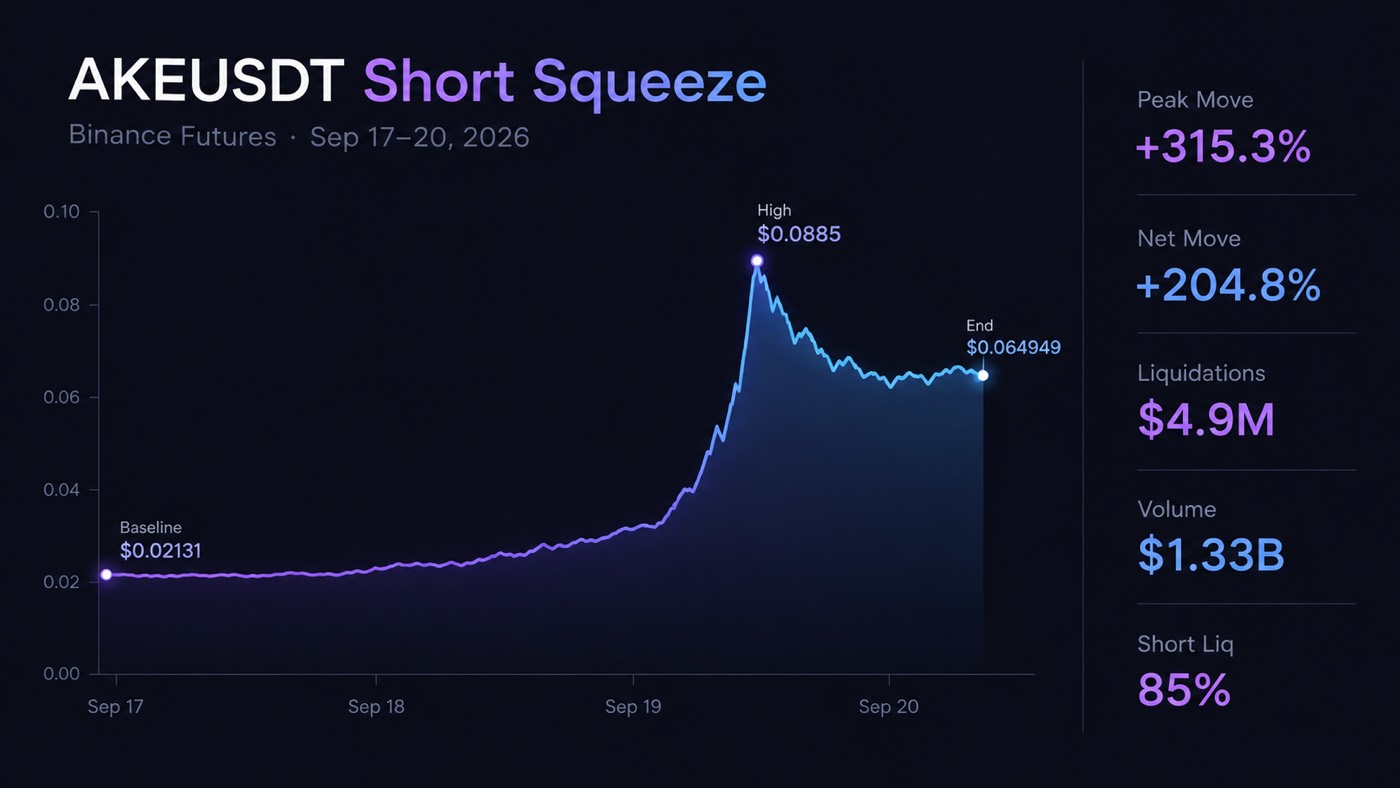
These episodes make AKE a useful reference case for a broader market-structure question. The relevant issue is the relationship between derivatives market size, the amount of inventory available on spot markets, and leveraged traders' positioning when prices begin to move.
The central question of this research is therefore:
When derivatives exposure becomes large relative to accessible spot liquidity, which combination of positioning and supply conditions turns that imbalance into forced market flow?
Building the Comparison Dataset
The listing dataset compiled for this research contains 131 projects with relevant Binance Alpha and Binance Futures listings between September 2025 and September 2026 and confirmed spot availability on at least one other centralized exchange.
Binance Alpha is a section of Binance Wallet that highlights new and early-stage crypto projects. Alpha tokens trade through on-chain markets, including Binance interfaces, and inclusion in Binance Alpha provides no guarantee of a subsequent Binance Spot listing. Binance Futures is Binance's derivatives market, while Binance Spot is its market for direct trading of the underlying tokens.
We assembled listing dates and current status from Binance Alpha records, Binance Futures records, Binance Spot availability, and external exchange listings. We deduplicated rebrands, contract migrations, and additional network versions of the same economic token.
At the research snapshot, 79 of the 131 projects simultaneously had active Binance Alpha availability, an active Binance perpetual contract, and no Binance Spot market.
A market cap threshold below $25 million reduced that group to 34 projects. An MC/FDV threshold of 25% or less reduced it to 17. A later market refresh left 16 projects inside both valuation thresholds.
The 16 remaining projects were then evaluated through three sequential market structure filters using a frozen September 24, 2026 research snapshot.
The first filter required open interest to be at least equal to market capitalization (OI/MC ≥ 1.0). Five tokens met this condition: TRADOOR, TRIA, LIGHT, BLUAI, and BASED.
The second filter required 24-hour futures turnover to be at least ten times reported spot turnover. All five tokens remained above this threshold in the frozen snapshot.
The third filter examined visible sell-side liquidity. A token remained in the comparison set when cumulative ask depth within 2% of the market price was below $100,000 across the first ten spot markets displayed by CoinGecko. TRADOOR, TRIA, LIGHT and BLUAI remained below this threshold. BASED showed approximately $198,000 of visible asks across its first ten displayed markets and therefore left the comparison set at this stage.
The resulting four-token set consists of TRADOOR, TRIA, BLUAI and LIGHT.
The thresholds are research filters designed to make the selection process reproducible. They have not been backtested as predictive boundaries. Interpret values close to a threshold cautiously because open interest, 24-hour turnover, and order book depth change continuously with market conditions.
CoinGecko depth also represents visible resting liquidity at the time of observation. The first ten markets cover only part of total liquidity when CoinGecko lists more than ten venues for a token. The supporting dataset preserves the exact snapshot values and source links.
We examine funding after this structural selection. It assesses the current positioning regime and does not determine whether a token enters the four-token comparison set.
AKE Already Had a Large Derivatives Market in July
AKE's July episode shows how quickly derivatives exposure grew relative to the token's size.
On July 16, AKE was trading near $0.00074 after an approximately 290% daily increase. Reported market capitalization was around $17 million, while FDV was around $75 million. Roughly 23% of supply was reported as circulating. Open interest on Aster, a crypto derivatives venue offering perpetual contracts, stood near $10.4 million, while 24-hour contract turnover reached approximately $24.7 million.
Large directional positions also appeared during the move. Three recently created wallets deposited $3 million in USDT and opened long positions with a combined contract exposure of 4.73 billion AKE, worth about $3.37 million at the time.
The July 15 Binance episode recorded $2.7 million in liquidations, with shorts representing 91% of the observed liquidations. The archived replay contains hundreds of thousands of order book observations, more than one million trade observations, and open interest and positioning data.
Funding around the broader July market was positive in contemporaneous snapshots. This matters for the later comparison because it shows that negative funding is only one possible manifestation of positioning stress. A short squeeze can develop while aggregate funding still reflects demand from leveraged longs.
By July, the relevant structural relationship was already present: a relatively small underlying token supported derivatives exposure large enough for forced exits to matter.
Accessible Supply Was Smaller Than the Headline Supply Categories Suggested
AKE has a total supply of 100 billion tokens. The official tokenomics allocates that supply across community incentives, investors, ecosystem growth, contributors, advisers, liquidity provision, and a community airdrop, with different vesting schedules for each category.
By September 2026, Tokenomics.com reported that 47.2 billion AKE had been unlocked, while market data counted approximately 22.8 billion as circulating. Another 52.8 billion remained locked. The difference leaves about 24.4 billion AKE unlocked but outside the reported circulating supply.
This distinction matters because supply categories describe different degrees of market accessibility. Locked tokens follow future release schedules. Unlocked tokens can remain in treasury, ecosystem, investor, or other addresses. Circulating tokens can remain inactive in wallets. Tokens deposited on exchanges or placed in liquidity pools are much closer to immediate execution.
Visible spot depth measures another layer of accessible inventory. A +2% depth figure represents the dollar value of sell orders currently visible in the order book between the market price and a price 2% higher. It captures resting liquidity at a specific moment. Market makers can replenish quotes, traders can transfer tokens between venues, and additional sellers can appear as prices change, so the figure is best interpreted as an immediate capacity snapshot.
This relationship between accessible inventory and derivatives exposure becomes important when forced orders begin reaching a market.
September Shows the Positioning Transition More Clearly
The September AKE episode provides a cleaner view of how derivatives positioning changed during a rapid repricing.
Coinranking recorded AKE closing near $0.0213 on September 17 with $16.93 million in open interest. The September 18 close was around $0.0462 with $34.53 million in OI. By September 19, the close reached about $0.0646, while OI stood at $38.87 million. On September 20, AKE closed near $0.0586 with $34.34 million in open interest.
Dollar-denominated OI rises sharply when the underlying token itself appreciates. Dividing dollar OI by the closing token price provides an approximate token equivalent that helps separate repricing from changes in outstanding position size.
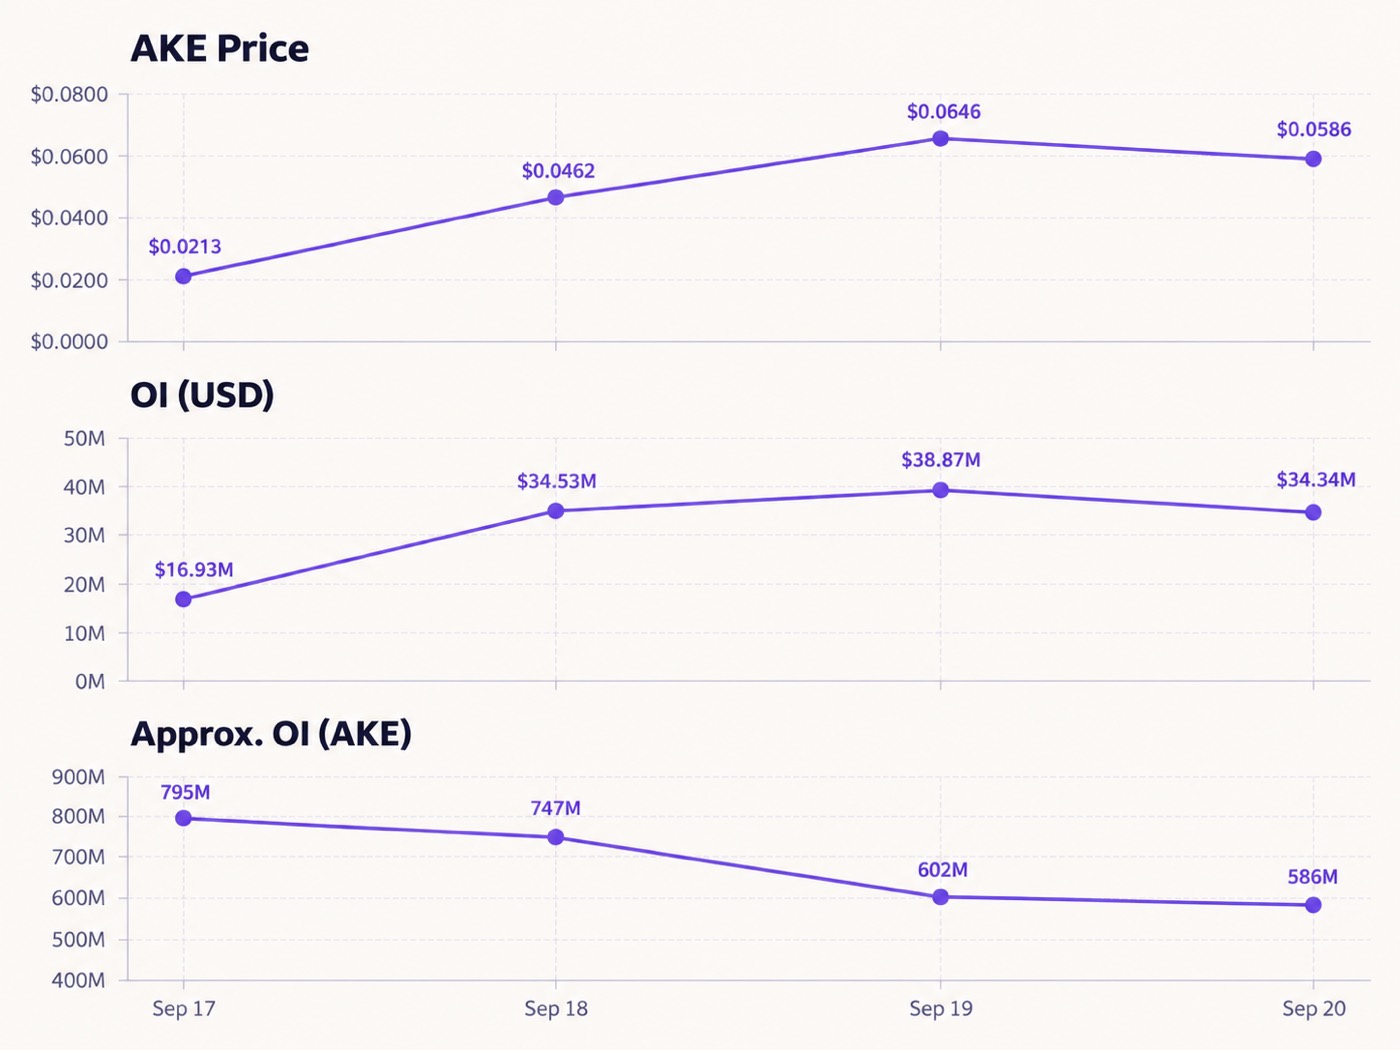
This calculation shows dollar OI expanding while its approximate token equivalent declined. Aggregate OI still includes both sides of every contract, so the calculation shows positions leaving the market without identifying their direction. The direction becomes clearer when you add liquidation and funding data.
On September 20, Binance funding for AKE reached minus 2% for the 08:00 UTC four-hour settlement. After the funding interval shifted to hourly settlements, the rate remained deeply negative at minus 1.4646% at 09:00 and minus 1.1368% at 10:00. Negative funding means shorts were paying longs to maintain their positions.
During the same broader episode, EdgeDepth recorded $4.9 million of liquidations, with 85% attributed to short positions. AKE rose as much as 315.3% from the archived baseline.
The September sequence therefore combines four observable conditions: rapid price appreciation, extreme positioning costs for shorts, predominantly short-side liquidations, and declining token-equivalent OI.
These observations provide stronger evidence of forced short exits than any one metric in isolation.
Which Conditions Actually Distinguish Forced Flow?
AKE provides one detailed case. A broader answer requires comparison with other market episodes.
We therefore conducted a separate event study using squeeze events and control events. Wherever possible, we paired the squeeze with a strong pump or volatility episode in the same token. Same token comparisons reduce some of the variation created by different token designs and supply structures.
The results show that several intuitive signals have limited explanatory power on their own.
Liquidity Stress Is a Structural Condition
EdgeDepth maintains historical base rate studies for individual market conditions. Its spread blowout condition measures moments when the bid-ask spread widens near the upper end of its normalized range, indicating deteriorating immediate liquidity.
Across 1,192 observations with a complete 24-hour forward window, a subsequent rise of at least 5% occurred in 21.3% of cases. The corresponding rate without the condition was 28.0%. A static liquidity shock therefore provided little evidence of an impending upside squeeze on its own.
Liquidity still matters mechanically. A thin market requires less incremental flow to move through available orders. The historical result shows that thin liquidity describes sensitivity to flow, while the direction and origin of that flow require additional evidence.
Extreme Funding Measures Crowding
Deeply negative funding often accompanies crowded short positioning because shorts pay longs to keep perpetual prices aligned with spot.
EdgeDepth's historical study of funding at or below minus 1% shortly before settlement found 33 observations with complete 24-hour outcomes. Price reached at least 5% above the starting level in 36.4% of them, while a drawdown of at least 10% occurred in 54.5%.
The distribution shows substantial instability in both directions.
Historical squeeze episodes in other perpetual markets also provide positive funding counterexamples, where strong short-liquidation skews occurred while funding remained positive. AKE's own July episode adds another example of a squeeze appearing during a broader positive funding environment.
Funding therefore works best as a measure of positioning stress and crowding. Its sign becomes informative when read together with price, liquidation direction and changes in open interest.
Gross Liquidation Volume Gives Only Part of the Picture
Liquidation intensity has much stronger associations with large subsequent moves. Across 1,749 observations with complete 24-hour outcomes, EdgeDepth found a move of at least +5% in 43.2% of cases and a drawdown of at least 10% in 31.8%.
Direction remains the critical issue.
BLUAI provides a particularly useful same-token comparison. BLUAI is the native utility token of Bluwhale, a decentralized AI and financial data infrastructure network where nodes support network operation and AI agent execution. The token is used for transactions, access, staking, and services within the Bluwhale ecosystem.
On August 8, EdgeDepth recorded a BLUAI pump that reached +74.6%, finished +59.6% above its baseline, and generated $287,000 in reported liquidations. Its archive recorded no squeeze-cause signal for that move.
A separate BLUAI episode on the same date was classified as a short squeeze. It reached +79.4%, finished +75.8% above its baseline, and generated $289,000 in liquidations, almost identical to the gross liquidation amount in the ordinary pump. The distinguishing observation was that 77% of liquidations were on the short side.
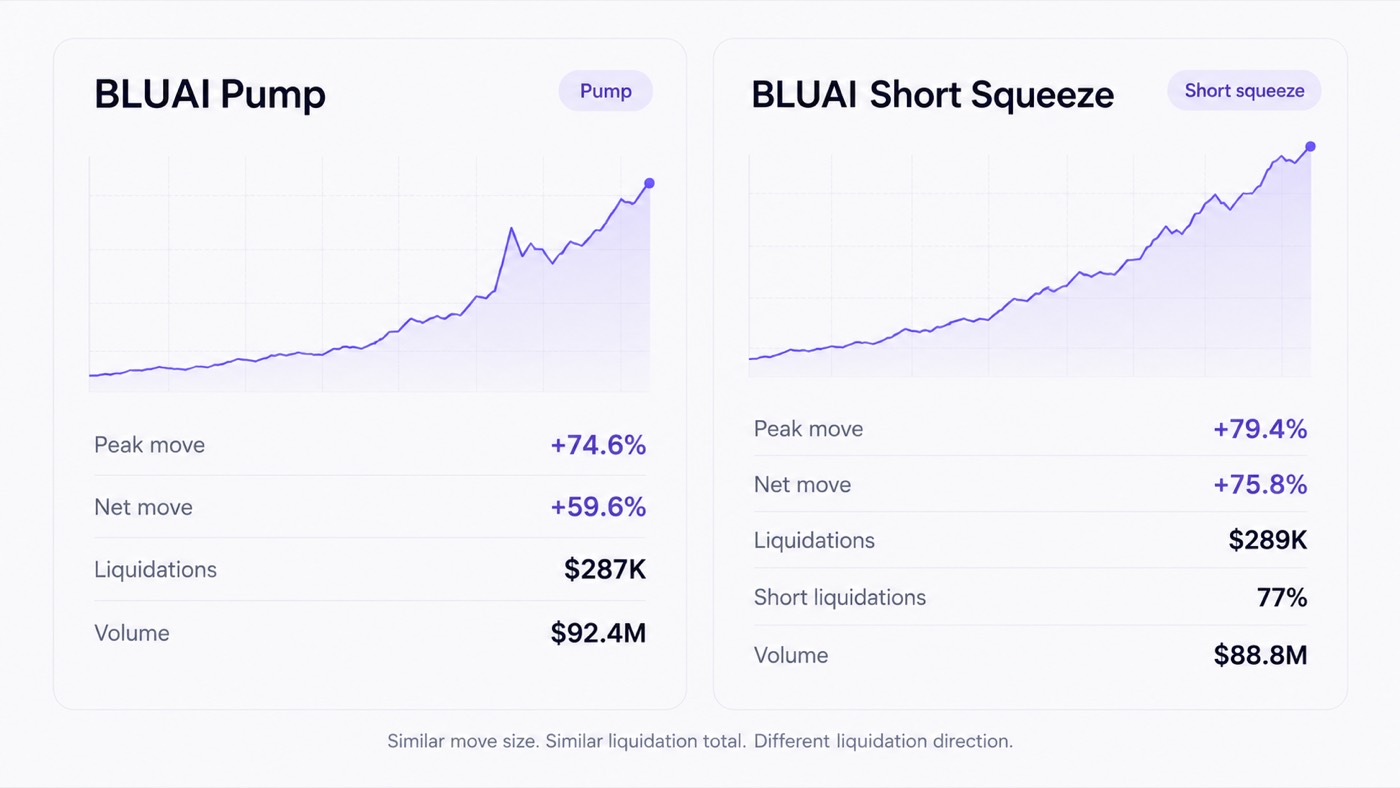
The comparison shows why total liquidation dollars carry limited information about forced directional flow. Liquidation side carries much more.
A six-pair same-token comparison assembled for this study produced the same general pattern. Peak price moves overlapped substantially between squeeze and control events, while squeeze episodes retained a much larger share of their peak move. Gross liquidation totals differed far less. The supporting research workbook preserves the event-level source links and calculations.
Sequence Matters More Than a Static Signal
The strongest result in the broader historical data appears when liquidity stress and liquidations are considered as a sequence.
EdgeDepth studied episodes where a spread blowout was followed by an elevated liquidation burst within 30 minutes. Of 38 observations, 32 reached at least +5% within the following 24 hours, an 84.2% rate.
The sample requires a substantial caveat. Ninety-two percent of the 38 observations occurred on a single date, so the result is highly concentrated and cannot support a general 84.2% probability estimate.
The sequence is still useful as evidence about mechanism. Static liquidity stress showed little directional information. Liquidation intensity indicated a high probability of large movement in either direction. When liquidity stress appeared first, and a liquidation burst followed, the observed outcomes became much more directionally asymmetric in this limited sample.
The evidence therefore supports a three-stage framework.
Structural sensitivity develops when derivatives exposure becomes large relative to the liquidity and inventory available on spot markets.
Positioning stress develops when leveraged exposure becomes increasingly crowded or expensive to maintain. Extreme funding, basis changes, and changes in token-equivalent OI can reveal this state.
Forced flow becomes directly observable when a rising market begins generating predominantly short-side liquidations while outstanding token-equivalent exposure stops expanding or declines. Limited spot capacity can amplify the resulting price displacement if fresh sell inventory fails to arrive quickly enough.
Historical data currently provide the strongest evidence for the positioning and liquidation stages. Historical accessible inventory remains harder to reconstruct consistently because synchronized order book depth, labeled exchange flows, and holder movements are incomplete for many older events. The supply component should therefore be treated as a market sensitivity variable whose causal contribution varies by episode.
Applying the Framework to Recent Binance Listings
Applying the three structural filters to the 16-token dataset left four markets for deeper analysis: TRADOOR, TRIA, BLUAI and LIGHT. Each had OI at least equal to market capitalization, futures turnover at least ten times reported spot turnover, and less than $100,000 of visible asks within 2% across the first ten CoinGecko spot markets in the September 24 research snapshot.
The four projects operate in different segments of the crypto market. Their inclusion in the comparison comes from measurable similarities in token market structure.
Tradoor is an on-chain derivatives protocol that combines perpetual futures and options. TRADOOR is the protocol's token. The project describes perpetual futures as leveraged contracts without an expiry date and positions its protocol as an on-chain venue for leveraged derivatives.
Tria develops self-custodial crypto infrastructure designed to route transactions and execution across multiple blockchain networks. TRIA is its ecosystem token and is used for settlement, staking, fee subsidies, routing incentives, and governance. Tria's BestPath infrastructure provides routing and execution across supported networks.
Bluwhale is a decentralized infrastructure network for financial AI and AI agents. BLUAI is its utility token and supports network transactions, staking, access, and agent-related activity.
Bitlight Labs develops Bitcoin infrastructure around the RGB asset protocol and the Lightning Network, including infrastructure for transferring RGB assets through Lightning channels. LIGHT is the project's token and is used within the Bitlight ecosystem, including protocol services.
Four tokens passed all three structural filters: TRADOOR, TRIA, BLUAI and LIGHT. Supplementary Table 1 shows the full selection path across all 16 tokens.
The September 24, 2026 research snapshot produced the following comparison:
| Metric | TRADOOR | TRIA | BLUAI | LIGHT |
|---|---|---|---|---|
| Market cap | ~$10.2M | ~$8.2M | ~$13.3M | ~$7.9M |
| Open interest | ~$18.6M | ~$14.1M | ~$16.5M | ~$13.6M |
| OI/market cap | ~1.8x | ~1.7x | ~1.2x | ~1.7x |
| Futures/spot volume | ~30.7x | ~10.7x | ~44.9x | ~16.0x |
| Observed asks within +2%* | ~$50.8K | ~$90K | ~$50.9K | ~$74.5K |
| Funding in snapshot | Limited comparable data | Positive funding | Positive funding | Positive funding |
Market cap, open interest, and turnover ratios are frozen research snapshot values from September 24, 2026. Observed ask depth is the sum of visible sell-side liquidity within 2% across the first ten spot markets CoinGecko displays. CoinGecko listed more than ten markets for each of these tokens, so the figures represent partial cross-venue depth rather than total market liquidity. Funding is shown where sufficiently comparable exchange-level data were available during the same research window.
CoinGlass provides the derivatives market data used for TRADOOR, TRIA, BLUAI and LIGHT, while CoinGecko provides venue-level spot depth. Since market capitalization, open interest, turnover, and order books change continuously, all cross-token comparisons in this section refer to the frozen September 24, 2026 research snapshot.
TRADOOR Has the Strongest Structural Imbalance
TRADOOR stands out because its outstanding derivatives exposure is large relative to the token's market capitalization, while nearby visible spot liquidity remains small in the research snapshot.
The holder data require careful interpretation. CryptoRank currently reports a total supply of 60 million TRADOOR on BNB Chain. The 100 largest addresses contain 99.6% of that supply, while 82.93% of total supply sits in contracts and 17.07% in wallets.
This makes raw holder concentration an unsuitable direct measure of independent whale ownership. A large contract address can represent protocol infrastructure, exchange custody, vesting, or another operational function. The relevant question is how much of that inventory can actually move into active spot markets.
CoinGecko's live spot table illustrates the thin nearby liquidity.
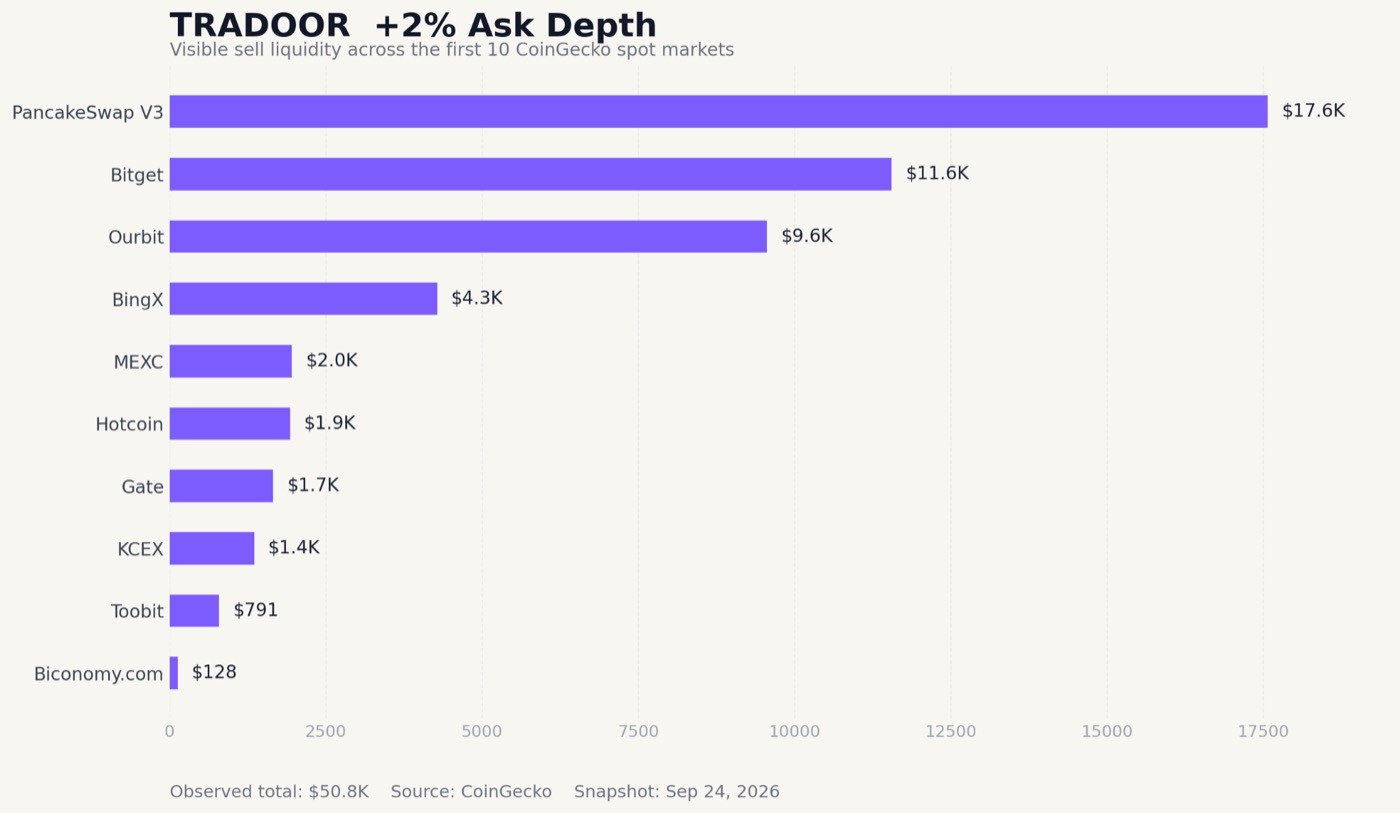
Its first ten displayed TRADOOR markets contain only tens of thousands of dollars of visible asks inside a 2% price range, spread across PancakeSwap, Gate, Bitget and several smaller centralized exchanges.
Within the four-token comparison, TRADOOR had the highest OI/MC ratio and the lowest observed +2% ask depth in the frozen snapshot. This combination gives it the most pronounced derivatives-versus-visible-liquidity imbalance in the selected group. A synchronized positioning transition would still be needed to compare it with an active AKE squeeze regime. Rising price, paired with predominantly short-side liquidations and contracting token-equivalent OI, would materially strengthen that comparison.
TRIA Shows Structural Sensitivity Without Extreme Holder Concentration
TRIA provides a useful variation within the four-token set because it shows structural sensitivity without extreme address-level holder concentration.
In the September 24 research snapshot, TRIA had a market capitalization of approximately $8.2 million and open interest of about $14.1 million, giving an OI/MC ratio of roughly 1.7. Futures turnover was approximately 10.7 times reported spot turnover, while the first ten CoinGecko spot markets contained roughly $90,000 of visible asks within 2% of the market price.
Holder data look considerably less concentrated than the raw distributions observed in TRADOOR, BLUAI and LIGHT. CertiK classified TRIA's concentration indicator as Low and reported a major holding ratio of 26.08% for the BNB Chain token contract. This makes TRIA useful for separating derivatives and liquidity structure from the holder-concentration hypothesis. A market can satisfy the structural filters even without extreme address concentration.
Funding in the September 24 snapshot remained positive, indicating that the positioning state had not developed the extreme short-side funding pressure observed during AKE's September episode. TRIA therefore met the structural conditions used in this research while remaining outside an active AKE-like forced flow regime.
BLUAI Combines Thin Visible Liquidity With a Known Supply Overhang
BLUAI has a different risk profile.
Derivatives activity remains large relative to both market capitalization and reported spot activity. CoinGlass has recently shown open interest above BLUAI's market capitalization and futures turnover many times larger than reported spot turnover.
CoinGecko's first ten displayed spot markets show visible +2% asks distributed across LBank, Bitget, KuCoin, MEXC, PancakeSwap and several smaller venues. Twenty-one spot markets are listed in total, so the first ten market sum captures only part of total cross-venue liquidity.
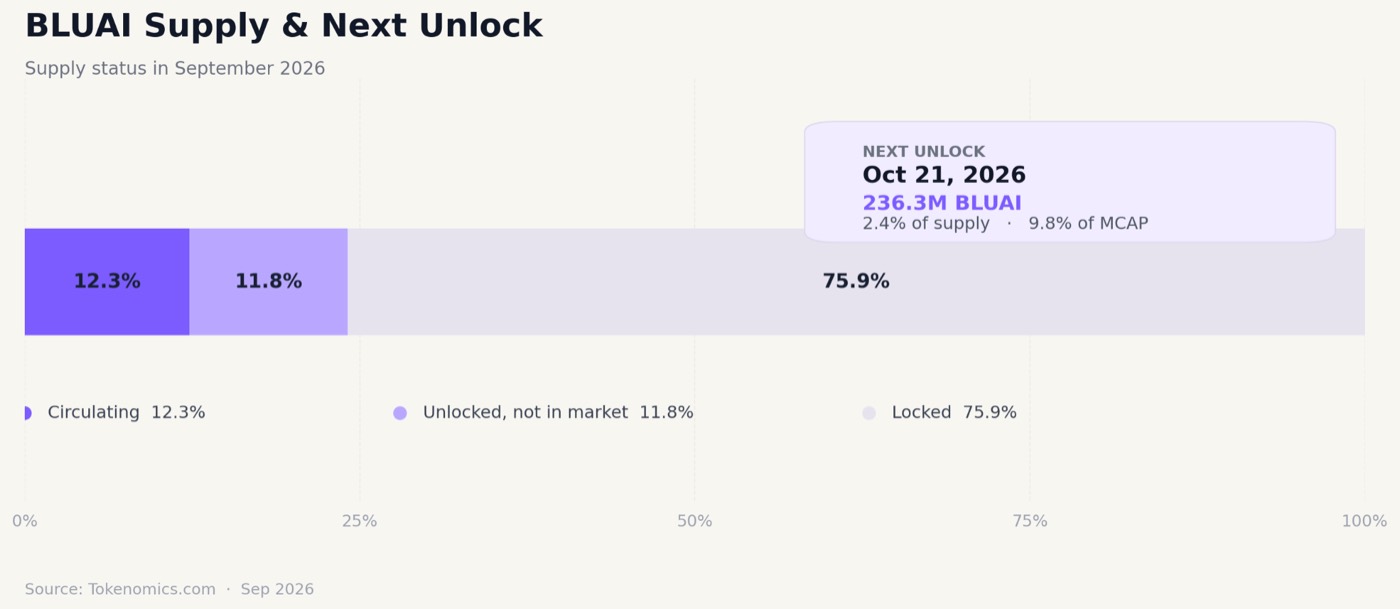
Supply data add an important second dimension. Tokenomics.com reports a total supply of 10 billion BLUAI. Around 24.1% had been unlocked by the September snapshot, while approximately 12.3% was reported as circulating. This leaves about 11.8% of total supply unlocked but outside reported market circulation. Another 75.9% remained subject to future vesting. The next scheduled unlock on October 21 releases 236.25 million BLUAI, equal to 2.4% of total supply and approximately 9.8% of market capitalization at the source's reference valuation.
Blockchain holder data also show why address labels matter. CryptoRank reports that 82.74% of BLUAI supply on BNB Chain sits in contracts. The three largest addresses alone are contracts containing 21%, 21% and 17.6% of supply, while another major address is a Binance proxy contract.
Current funding provides little evidence of short side stress. In the synchronized September 24 snapshot, BLUAI funding on Bybit remained positive at 0.005% per four-hour settlement, meaning longs were paying shorts.
BLUAI therefore combines structural sensitivity with a meaningful potential source of future supply. Its August history also demonstrates that the same token can experience a large ordinary pump and a short squeeze with almost identical gross liquidation totals. That makes liquidation direction especially valuable for monitoring this market.
LIGHT Shows Similar Structural Sensitivity With Different Current Positioning
Bitlight's LIGHT token also has open interest well above its market capitalization in recent CoinGlass data. CoinGlass recorded market cap near $8 million and OI near $13.8 million in the latest retrieved reading.
CoinGecko lists LIGHT across centralized and decentralized spot venues. The first ten displayed markets include PancakeSwap, Gate, KuCoin, Bitget, and several smaller exchanges, with visible +2% depth concentrated mainly on a few venues.
LIGHT's address distribution is also contract-heavy. The broader holder analysis used in the research showed a large share of supply associated with contract addresses, reinforcing the need to separate technical custody from economic ownership. Bitlight Labs develops infrastructure that combines the RGB protocol with Bitcoin's Lightning Network, and LIGHT is used within that ecosystem.
Funding provides a clearer distinction from AKE's September state. Binance LIGHT funding remained positive throughout the September 24 readings, including 0.0153% at 12:00 UTC, 0.0332% at 16:00 and 0.0133% at 20:00. Long positions were therefore paying short positions during those settlements.
LIGHT currently fits the structural sensitivity part of the framework: a small token market, substantial open derivatives exposure, and limited visible nearby liquidity. Its observed positioning reflects a different state than the period of extreme short-side funding pressure recorded in AKE.
What Turns the Imbalance Into Forced Market Flow
The combined AKE reconstruction, matched event comparisons, and historical condition studies allow the central research question to be answered more precisely.
Large derivatives exposure relative to spot capacity creates sensitivity. Thin books determine how strongly a given amount of order flow can affect price, while supply schedules and exchange inventory determine how quickly new liquidity can arrive.
Positioning becomes more important once price begins moving. Extreme funding indicates that maintaining leveraged exposure has become expensive for one side of the market. The sign shows who is paying whom at that moment, but historical evidence shows that the sign alone provides limited information about whether a squeeze will develop.
Forced flow becomes visible when liquidations become directional. During an upward move, a rising short liquidation share shows that traders positioned for lower prices are being forced to buy back exposure. Declining or stagnant OI in token terms adds evidence that positions are leaving the market as price rises.
The most informative observed sequence therefore looks like this:
large derivatives exposure relative to spot capacity → constrained nearby liquidity → rising price → stressed leveraged positioning → predominantly short side liquidations → open exposure stops expanding or contracts → forced buying interacts with limited available inventory
Supply determines how long that feedback can persist. Exchange deposits, token unlocks and deeper market making can deliver additional inventory and increase the market's capacity to absorb forced orders. Continued scarcity of nearby offers leaves price more sensitive to the liquidation flow.
Historical evidence most strongly supports the liquidation and positioning part of this sequence. The liquidity sequence study also points in the same direction, although its small and highly concentrated sample requires caution. Historical supply availability remains the least consistently observable part because synchronized order books, labeled wallet flows and exchange balances are unavailable for many older events.
What the Four Selected Markets Show
Applying the same structural criteria across the full 16-token set produced four markets: TRADOOR, TRIA, BLUAI and LIGHT. All four combined open interest at least equal to market capitalization, futures turnover at least ten times reported spot turnover, and less than $100,000 of visible asks within 2% across the first ten CoinGecko spot markets in the frozen September 24 snapshot.
The similarities end at the structural level. Each market reaches that condition through a different combination of derivatives activity, spot liquidity, and supply structure.
TRADOOR had the highest OI/MC ratio in the group at roughly 1.8 and approximately $50.8K of observed +2% ask depth. Its holder data are heavily affected by contract balances, which limits conclusions about economic ownership. The derivatives-versus-visible-liquidity imbalance is strongest in the four-token snapshot.
TRIA had an OI/MC ratio of roughly 1.7 and around $90K of observed +2% ask depth. Its relatively low address concentration provides a useful counterexample within the group: extreme holder concentration is not required for a market to show the derivatives and liquidity structure captured by the filters. Funding remained positive in the snapshot.
BLUAI had a lower OI/MC ratio of roughly 1.2 but the highest futures-to-spot turnover ratio in the group at approximately 45x, alongside about $50.9K of observed +2% ask depth. Its supply structure adds a separate variable because unlocked supply outside reported circulation and scheduled future unlocks can increase the inventory available to the market.
LIGHT combined an OI/MC ratio of roughly 1.7 with approximately $74.5K of observed +2% ask depth. Its funding remained positive in the research snapshot, putting current positioning in a different state than the extreme short-side pressure observed during AKE's September squeeze.
At the September 24 snapshot, the full AKE September positioning sequence was absent across all four markets. Structural sensitivity was present, but evidence of active forced short flow had yet to appear.
The monitoring question is therefore the same across TRADOOR, TRIA, BLUAI and LIGHT: whether continued price appreciation begins to coincide with stressed leveraged positioning, an increasing short liquidation share, and token-equivalent OI that stops expanding or begins to contract while nearby spot liquidity remains constrained.
The AKE case and the comparative event study suggest a clear distinction between the two stages. Structural sensitivity identifies markets where derivatives exposure is large relative to immediate spot capacity. Directional forced liquidations provide the clearest observable evidence that this sensitivity has developed into active forced market flow.
Supplementary table: full selection from the 16-token set
The table below shows how the three structural filters were applied to all 16 tokens that remained after the market capitalization and MC/FDV stage. The filters were applied sequentially using the frozen September 24, 2026 research snapshot. A token that failed an earlier stage was excluded before the subsequent filters were applied
| Token | MC/FDV | OI/MC | OI/MC ≥ 1.0 | Futures/spot ≥ 10x | +2% asks < $100K | Result |
|---|---|---|---|---|---|---|
| TRADOOR | 23.9% | 1.82x | Yes | Yes | Yes, ~$50.8K | Selected |
| TRIA | 21.6% | 1.72x | Yes | Yes | Yes, ~$90K | Selected |
| LIGHT | 10.3% | 1.71x | Yes | Yes | Yes, ~$74.5K | Selected |
| BASED | 23.5% | 1.29x | Yes | Yes | No, ~$198.3K | Excluded at depth stage |
| BLUAI | 12.3% | 1.24x | Yes | Yes | Yes, ~$50.9K | Selected |
| FIGHT | 20.5% | 0.91x | No | Not evaluated | Not evaluated | Excluded at OI/MC stage |
| COLLECT | 17.9% | 0.90x | No | Not evaluated | Not evaluated | Excluded at OI/MC stage |
| CLO | 12.9% | 0.68x | No | Not evaluated | Not evaluated | Excluded at OI/MC stage |
| ON | 14.4% | 0.63x | No | Not evaluated | Not evaluated | Excluded at OI/MC stage |
| JCT | 23.0% | 0.59x | No | Not evaluated | Not evaluated | Excluded at OI/MC stage |
| INX | 19.9% | 0.54x | No | Not evaluated | Not evaluated | Excluded at OI/MC stage |
| STBL | 7.0% | 0.53x | No | Not evaluated | Not evaluated | Excluded at OI/MC stage |
| WET | 17.1% | 0.51x | No | Not evaluated | Not evaluated | Excluded at OI/MC stage |
| TRUST | 17.0% | 0.43x | No | Not evaluated | Not evaluated | Excluded at OI/MC stage |
| STAR | 18.6% | 0.38x | No | Not evaluated | Not evaluated | Excluded at OI/MC stage |
| CTR | 15.0% | 0.21x | No | Not evaluated | Not evaluated | Excluded at OI/MC stage |
Filters were applied sequentially. Tokens with OI/MC below 1.0 were removed before the futures to spot turnover and order book depth stages, so later fields are left blank. All values refer to the frozen September 24, 2026 research snapshot. The supporting research dataset preserves the timestamped source records and calculations.
Research report by Roman Korotchin, co-founder of Origami.tech. Cryptoindex.ai publishes it for information. It is not investment advice, and the figures describe a frozen research snapshot that can change as markets move.